A global review of disaster reduction initiatives - Welcome to the ...
A global review of disaster reduction initiatives - Welcome to the ...
A global review of disaster reduction initiatives - Welcome to the ...

You also want an ePaper? Increase the reach of your titles
YUMPU automatically turns print PDFs into web optimized ePapers that Google loves.
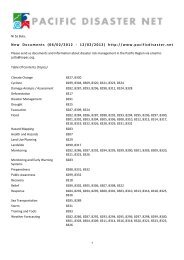
consideration about <strong>the</strong> nature <strong>of</strong> impacts and<strong>the</strong> severity <strong>of</strong> various consequences <strong>of</strong> differenthazards on affected populations.Hazard mapping, awarenessand public policyA key dimension <strong>of</strong> hazard assessment is <strong>the</strong>presentation <strong>of</strong> <strong>the</strong> results and <strong>the</strong> understanding<strong>of</strong> <strong>the</strong> added value by policy makers. Mapscan be prepared manually using standard car<strong>to</strong>graphictechniques or with a GIS. Differenttypes <strong>of</strong> hazards will require different mappingtechniques. The importance lies in <strong>the</strong> easyunderstanding and use <strong>of</strong> <strong>the</strong> information generated.For example, maps are <strong>the</strong> standart format forpresenting flood hazards. The flood-hazardareas are usually divided according <strong>to</strong> severity(deep or shallow), type (quiet water or highvelocity) or frequency. In <strong>the</strong> case <strong>of</strong> volcanichazards, <strong>the</strong> zoning <strong>of</strong> each direct and indirecthazards can be drawn according <strong>to</strong> <strong>the</strong> intensity,<strong>the</strong> extent <strong>of</strong> <strong>the</strong> hazard, <strong>the</strong> frequency <strong>of</strong>occurrence or in combination. Composite phenomenaand hazard maps are recognised as animportant <strong>to</strong>ol for joint hazard assessments.These combined hazard assessments need <strong>to</strong>be presented using a simple classification, suchas high, medium and low risk, or no danger.One <strong>of</strong> <strong>the</strong> constraining fac<strong>to</strong>rs in hazardmapping is not so much <strong>the</strong> lack <strong>of</strong> infrastructurebut <strong>the</strong> lack <strong>of</strong> proper training capabilities.There are many government employeesthat do not have computer access . Hazardmaps are also not as widely used as <strong>the</strong>y couldRisk awareness and assessmentSeveral <strong>initiatives</strong> on hazard mapping were developedduring <strong>the</strong> 1990s, as part <strong>of</strong> IDNDR. One example is<strong>the</strong> “Eastern Asia Natural Hazards Mapping Project”(EANHMP), started in Japan in 1994. The objectives<strong>of</strong> <strong>the</strong> project were <strong>to</strong> enhance awareness on naturalhazards, in particular geological hazards among plannersand policy makers <strong>of</strong> national and regional development,as well as general public in a given region,promote scientific studies on geological hazards, andtransfer technology on hazard mapping <strong>to</strong> developingcountries through collaborative activities. The EasternAsia Geological Hazards Map is one <strong>of</strong> <strong>the</strong> productsalready available.Source: Geological Survey <strong>of</strong> Japan, AIST, 2002be, were more planners and decision-makersaware <strong>of</strong> <strong>the</strong>ir potential. For example, inBangladesh, while many different entities arecarrying out various projects in risk and hazardmapping and land-use planning, <strong>the</strong>reexists no common focal point for easy access <strong>to</strong>this information. Moreover, communication isdeficient : maps are not shared, and data iscollected several times, or mismanaged.Vulnerability and capacity assessmentVulnerability and capacity assessments are anindispensable complement <strong>to</strong> hazard assessmentexercises. Despite <strong>the</strong> considerable effortsand achievements reflected in improved qualityand coverage <strong>of</strong> scientific data on differenthazards, <strong>the</strong> mapping and assessing <strong>of</strong> social,economic and environmental vulnerabilities <strong>of</strong><strong>the</strong> population are not equally developed. Some2High risk cholera areas due <strong>to</strong> polluted surface water (2001)In South Africa, various institutions are engaged in hazard mapping. While projects are sometimesconducted in isolation and <strong>the</strong> data is not widely used, <strong>the</strong>re are o<strong>the</strong>r examples where <strong>the</strong> resultinginformation is beneficial <strong>to</strong> additional institutions beyond <strong>the</strong> one which collected it. Most hazardmaps are becoming available online and <strong>the</strong>y <strong>of</strong>ten function as clickable image maps containing additionalinformation about particular areas. The Agriculture Research Council, <strong>the</strong> National DisasterManagement Centre, <strong>the</strong> Department <strong>of</strong> Water Affairs and Forestry, and <strong>the</strong> Department <strong>of</strong> Healthare all using satellite data <strong>to</strong> compile hazard maps, which <strong>the</strong>n become part <strong>of</strong> <strong>the</strong>ir much larger geographicalinformation systems. Use <strong>of</strong> US/NOAA satellite data fur<strong>the</strong>r enables <strong>the</strong> generation <strong>of</strong>locally relevant geo-referenced maps. The National Botanical Institute also embarked on <strong>the</strong> mapping<strong>of</strong> degradation patterns for <strong>the</strong> whole <strong>of</strong> South Africa. These maps provide valuable information on<strong>the</strong> state <strong>of</strong> South Africa’s ground cover.Source: NDMC (http://sandmc.pwv.gov.za/ndmc/cholera/Maps/Nmmp.jpg)69