

7.3 billion - Citigroup
7.3 billion - Citigroup
7.3 billion - Citigroup

Create successful ePaper yourself
Turn your PDF publications into a flip-book with our unique Google optimized e-Paper software.
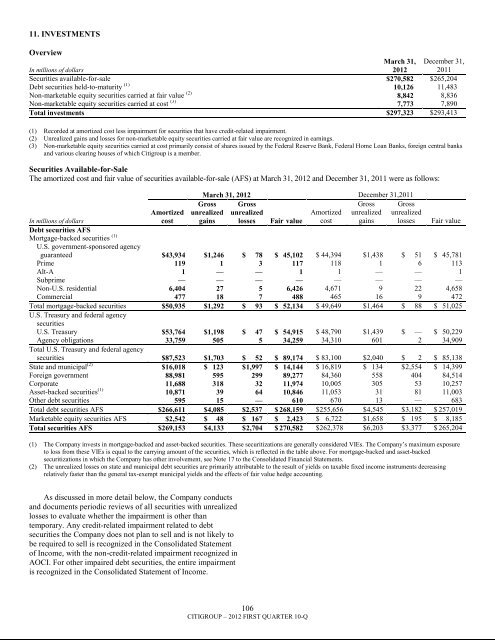
11. INVESTMENTSOverviewIn millions of dollarsMarch 31,2012December 31,2011Securities available-for-sale $270,582 $265,204Debt securities held-to-maturity (1) 10,126 11,483Non-marketable equity securities carried at fair value (2) 8,842 8,836Non-marketable equity securities carried at cost (3) 7,773 7,890Total investments $297,323 $293,413(1) Recorded at amortized cost less impairment for securities that have credit-related impairment.(2) Unrealized gains and losses for non-marketable equity securities carried at fair value are recognized in earnings.(3) Non-marketable equity securities carried at cost primarily consist of shares issued by the Federal Reserve Bank, Federal Home Loan Banks, foreign central banksand various clearing houses of which <strong>Citigroup</strong> is a member.Securities Available-for-SaleThe amortized cost and fair value of securities available-for-sale (AFS) at March 31, 2012 and December 31, 2011 were as follows:AmortizedcostMarch 31, 2012 December 31,2011GrossGrossunrealizedAmortized unrealizedlosses Fair value cost gainsGrossunrealizedgainsGrossunrealizedlossesIn millions of dollarsFair valueDebt securities AFSMortgage-backed securities (1)U.S. government-sponsored agencyguaranteed $43,934 $1,246 $ 78 $ 45,102 $ 44,394 $1,438 $ 51 $ 45,781Prime 119 1 3 117 118 1 6 113Alt-A 1 — — 1 1 — — 1Subprime — — — — — — — —Non-U.S. residential 6,404 27 5 6,426 4,671 9 22 4,658Commercial 477 18 7 488 465 16 9 472Total mortgage-backed securities $50,935 $1,292 $ 93 $ 52,134 $ 49,649 $1,464 $ 88 $ 51,025U.S. Treasury and federal agencysecuritiesU.S. Treasury $53,764 $1,198 $ 47 $ 54,915 $ 48,790 $1,439 $ — $ 50,229Agency obligations 33,759 505 5 34,259 34,310 601 2 34,909Total U.S. Treasury and federal agencysecurities $87,523 $1,703 $ 52 $ 89,174 $ 83,100 $2,040 $ 2 $ 85,138State and municipal (2) $16,018 $ 123 $ 1,997 $ 14,144 $ 16,819 $ 134 $ 2,554 $ 14,399Foreign government 88,981 595 299 89,277 84,360 558 404 84,514Corporate 11,688 318 32 11,974 10,005 305 53 10,257Asset-backed securities (1) 10,871 39 64 10,846 11,053 31 81 11,003Other debt securities 595 15 — 610 670 13 — 683Total debt securities AFS $266,611 $4,085 $2,537 $ 268,159 $255,656 $4,545 $ 3,182 $ 257,019Marketable equity securities AFS $2,542 $ 48 $ 167 $ 2,423 $ 6,722 $1,658 $ 195 $ 8,185Total securities AFS $269,153 $4,133 $ 2,704 $ 270,582 $262,378 $6,203 $ 3,377 $ 265,204(1) The Company invests in mortgage-backed and asset-backed securities. These securitizations are generally considered VIEs. The Company‘s maximum exposureto loss from these VIEs is equal to the carrying amount of the securities, which is reflected in the table above. For mortgage-backed and asset-backedsecuritizations in which the Company has other involvement, see Note 17 to the Consolidated Financial Statements.(2) The unrealized losses on state and municipal debt securities are primarily attributable to the result of yields on taxable fixed income instruments decreasingrelatively faster than the general tax-exempt municipal yields and the effects of fair value hedge accounting.As discussed in more detail below, the Company conductsand documents periodic reviews of all securities with unrealizedlosses to evaluate whether the impairment is other thantemporary. Any credit-related impairment related to debtsecurities the Company does not plan to sell and is not likely tobe required to sell is recognized in the Consolidated Statementof Income, with the non-credit-related impairment recognized inAOCI. For other impaired debt securities, the entire impairmentis recognized in the Consolidated Statement of Income.106CITIGROUP – 2012 FIRST QUARTER 10-Q


