

7.3 billion - Citigroup
7.3 billion - Citigroup
7.3 billion - Citigroup

Create successful ePaper yourself
Turn your PDF publications into a flip-book with our unique Google optimized e-Paper software.
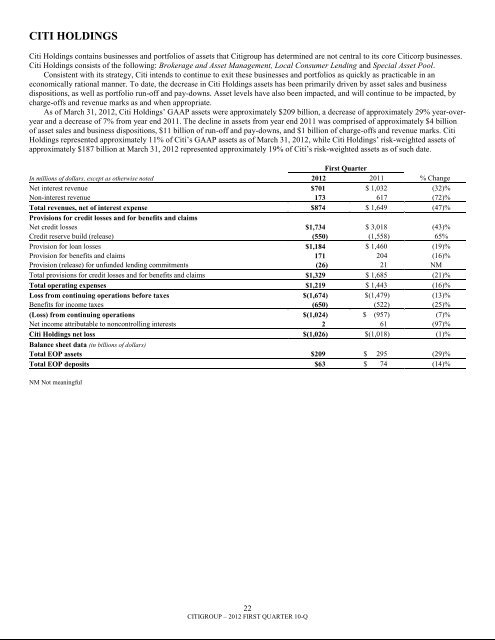
CITI HOLDINGSCiti Holdings contains businesses and portfolios of assets that <strong>Citigroup</strong> has determined are not central to its core Citicorp businesses.Citi Holdings consists of the following: Brokerage and Asset Management, Local Consumer Lending and Special Asset Pool.Consistent with its strategy, Citi intends to continue to exit these businesses and portfolios as quickly as practicable in aneconomically rational manner. To date, the decrease in Citi Holdings assets has been primarily driven by asset sales and businessdispositions, as well as portfolio run-off and pay-downs. Asset levels have also been impacted, and will continue to be impacted, bycharge-offs and revenue marks as and when appropriate.As of March 31, 2012, Citi Holdings‘ GAAP assets were approximately $209 <strong>billion</strong>, a decrease of approximately 29% year-overyearand a decrease of 7% from year end 2011. The decline in assets from year end 2011 was comprised of approximately $4 <strong>billion</strong>of asset sales and business dispositions, $11 <strong>billion</strong> of run-off and pay-downs, and $1 <strong>billion</strong> of charge-offs and revenue marks. CitiHoldings represented approximately 11% of Citi‘s GAAP assets as of March 31, 2012, while Citi Holdings‘ risk-weighted assets ofapproximately $187 <strong>billion</strong> at March 31, 2012 represented approximately 19% of Citi‘s risk-weighted assets as of such date.First QuarterIn millions of dollars, except as otherwise noted 2012 2011 % ChangeNet interest revenue $701 $ 1,032 (32)%Non-interest revenue 173 617 (72)%Total revenues, net of interest expense $874 $ 1,649 (47)%Provisions for credit losses and for benefits and claimsNet credit losses $1,734 $ 3,018 (43)%Credit reserve build (release) (550) (1,558) 65%Provision for loan losses $1,184 $ 1,460 (19)%Provision for benefits and claims 171 204 (16)%Provision (release) for unfunded lending commitments (26) 21 NMTotal provisions for credit losses and for benefits and claims $1,329 $ 1,685 (21)%Total operating expenses $1,219 $ 1,443 (16)%Loss from continuing operations before taxes $(1,674) $(1,479) (13)%Benefits for income taxes (650) (522) (25)%(Loss) from continuing operations $(1,024) $ (957) (7)%Net income attributable to noncontrolling interests 2 61 (97)%Citi Holdings net loss $(1,026) $(1,018) (1)%Balance sheet data (in <strong>billion</strong>s of dollars)Total EOP assets $209 $ 295 (29)%Total EOP deposits $63 $ 74 (14)%NM Not meaningful22CITIGROUP – 2012 FIRST QUARTER 10-Q


