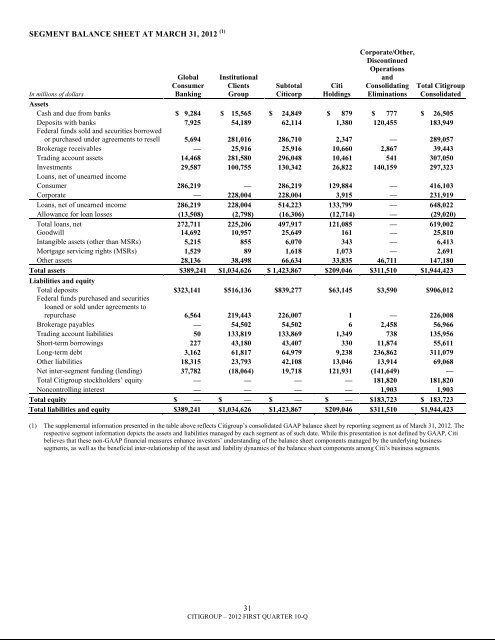
SEGMENT BALANCE SHEET AT MARCH 31, 2012 (1)In millions of dollarsGlobalConsumerBankingInstitutionalClientsGroupSubtotalCiticorpCitiHoldingsCorporate/Other,DiscontinuedOperationsandConsolidating Total <strong>Citigroup</strong>Eliminations ConsolidatedAssetsCash and due from banks $ 9,284 $ 15,565 $ 24,849 $ 879 $ 777 $ 26,505Deposits with banks 7,925 54,189 62,114 1,380 120,455 183,949Federal funds sold and securities borrowedor purchased under agreements to resell 5,694 281,016 286,710 2,347 — 289,057Brokerage receivables — 25,916 25,916 10,660 2,867 39,443Trading account assets 14,468 281,580 296,048 10,461 541 307,050Investments 29,587 100,755 130,342 26,822 140,159 297,323Loans, net of unearned incomeConsumer 286,219 — 286,219 129,884 — 416,103Corporate — 228,004 228,004 3,915 — 231,919Loans, net of unearned income 286,219 228,004 514,223 133,799 — 648,022Allowance for loan losses (13,508) (2,798) (16,306) (12,714) — (29,020)Total loans, net 272,711 225,206 497,917 121,085 — 619,002Goodwill 14,692 10,957 25,649 161 — 25,810Intangible assets (other than MSRs) 5,215 855 6,070 343 — 6,413Mortgage servicing rights (MSRs) 1,529 89 1,618 1,073 — 2,691Other assets 28,136 38,498 66,634 33,835 46,711 147,180Total assets $389,241 $1,034,626 $ 1,423,867 $209,046 $311,510 $1,944,423Liabilities and equityTotal deposits $323,141 $516,136 $839,277 $63,145 $3,590 $906,012Federal funds purchased and securitiesloaned or sold under agreements torepurchase 6,564 219,443 226,007 1 — 226,008Brokerage payables — 54,502 54,502 6 2,458 56,966Trading account liabilities 50 133,819 133,869 1,349 738 135,956Short-term borrowings 227 43,180 43,407 330 11,874 55,611Long-term debt 3,162 61,817 64,979 9,238 236,862 311,079Other liabilities 18,315 23,793 42,108 13,046 13,914 69,068Net inter-segment funding (lending) 37,782 (18,064) 19,718 121,931 (141,649) —Total <strong>Citigroup</strong> stockholders‘ equity — — — — 181,820 181,820Noncontrolling interest — — — — 1,903 1,903Total equity $ — $ — $ — $ — $183,723 $ 183,723Total liabilities and equity $389,241 $1,034,626 $1,423,867 $209,046 $311,510 $1,944,423(1) The supplemental information presented in the table above reflects <strong>Citigroup</strong>‘s consolidated GAAP balance sheet by reporting segment as of March 31, 2012. Therespective segment information depicts the assets and liabilities managed by each segment as of such date. While this presentation is not defined by GAAP, Citibelieves that these non-GAAP financial measures enhance investors‘ understanding of the balance sheet components managed by the underlying businesssegments, as well as the beneficial inter-relationship of the asset and liability dynamics of the balance sheet components among Citi‘s business segments.31CITIGROUP – 2012 FIRST QUARTER 10-Q
CAPITAL RESOURCES AND LIQUIDITYCAPITAL RESOURCESOverviewCapital is used primarily to support assets in Citi‘s businessesand to absorb market, credit or operational losses. Citi generatescapital through earnings from its operating businesses. Citi mayaugment its capital through issuances of common stock,perpetual preferred stock and equity issued through awardsunder employee benefit plans, among other issuances. Citi hasalso augmented its regulatory capital through the issuance ofdebt underlying trust preferred securities, although the treatmentof such instruments as regulatory capital will be phased outunder Basel III and The Dodd-Frank Wall Street Reform andConsumer Protection Act of 2010 (see the ―Regulatory CapitalStandards‖ and ―Risk Factors—Regulatory Risks‖ sections ofCiti‘s 2011 Annual Report on Form 10-K). Further, the impactof future events on Citi‘s business results, such as corporate andasset dispositions, as well as changes in regulatory andaccounting standards, may also affect Citi‘s capital levels.For additional information on Citi‘s capital resources,including an overview of <strong>Citigroup</strong>‘s capital managementframework and regulatory capital standards and developments,see ―Capital Resources and Liquidity—Capital Resources‖ and―Risk Factors‖ in <strong>Citigroup</strong>‘s 2011 Annual Report on Form 10-K.Capital Ratios<strong>Citigroup</strong> is subject to the risk-based capital guidelines issuedby the Federal Reserve Board. Historically, capital adequacy hasbeen measured, in part, based on two risk-based capital ratios,the Tier 1 Capital and Total Capital (Tier 1 Capital + Tier 2Capital) ratios. Tier 1 Capital consists of the sum of ―corecapital elements,‖ such as qualifying common stockholders‘equity, as adjusted, qualifying noncontrolling interests, andqualifying trust preferred securities, principally reduced bygoodwill, other disallowed intangible assets, and disalloweddeferred tax assets. Total Capital also includes ―supplementary‖Tier 2 Capital elements, such as qualifying subordinated debtand a limited portion of the allowance for credit losses. Bothmeasures of capital adequacy are stated as a percentage of riskweightedassets.In 2009, the U.S. banking regulators developed a newmeasure of capital termed ―Tier 1 Common,‖ which is definedas Tier 1 Capital less non-common elements, includingqualifying perpetual preferred stock, qualifying noncontrollinginterests, and qualifying trust preferred securities. For moredetail on all of these capital metrics, see ―Components ofCapital Under Regulatory Guidelines‖ below.<strong>Citigroup</strong>‘s risk-weighted assets are principally derivedfrom application of the risk-based capital guidelines related tothe measurement of credit risk. Pursuant to these guidelines, onbalance-sheetassets and the credit equivalent amount of certainoff-balance-sheet exposures (such as financial guarantees,unfunded lending commitments, letters of credit andderivatives) are assigned to one of several prescribed riskweightcategories based upon the perceived credit riskassociated with the obligor or, if relevant, the guarantor, thenature of the collateral, or external credit ratings. Risk-weightedassets also incorporate a measure for market risk on coveredtrading account positions and all foreign exchange andcommodity positions whether or not carried in the tradingaccount. Excluded from risk-weighted assets are any assets,such as goodwill and deferred tax assets, to the extent requiredto be deducted from regulatory capital. See ―Components ofCapital Under Regulatory Guidelines‖ below.<strong>Citigroup</strong> is also subject to a Leverage ratio requirement, anon-risk-based measure of capital adequacy, which is defined asTier 1 Capital as a percentage of quarterly adjusted average totalassets.To be ―well capitalized‖ under current federal bankregulatory agency definitions, a bank holding company musthave a Tier 1 Capital ratio of at least 6%, a Total Capital ratio ofat least 10%, and not be subject to a Federal Reserve Boarddirective to maintain higher capital levels. In addition, theFederal Reserve Board expects bank holding companies tomaintain a minimum Leverage ratio of 3% or 4%, depending onfactors specified in its regulations. The following table sets forth<strong>Citigroup</strong>‘s regulatory capital ratios as of March 31, 2012 andDecember 31, 2011:<strong>Citigroup</strong> Regulatory Capital RatiosMar. 31,2012Dec. 31,2011Tier 1 Common 12.50% 11.80%Tier 1 Capital 14.26 13.55Total Capital (Tier 1 Capital + Tier 2 Capital) 17.64 16.99Leverage 7.55 7.19As indicated in the table above, <strong>Citigroup</strong> was ―wellcapitalized‖ under the current federal bank regulatory agencydefinitions as of March 31, 2012 and December 31, 2011.In addition to the current regulatory capital ratios andguidelines discussed above, as more fully described in ―CapitalResources and Liquidity – Capital Resources – RegulatoryCapital Standards‖ of Citi‘s 2011 Annual Report on Form 10-K,the Basel Committee has issued final rules to further strengthenexisting capital requirements (Basel III). While the U.S.banking agencies have yet to issue the proposed U.S. version ofthe Basel III rules, Citi estimates that, as of March 31, 2012, itsBasel III Tier 1 Common ratio was 7.2%. Citi‘s estimate of itsTier 1 Common ratio under Basel III as of March 31, 2012 isbased on its current interpretation, expectations andunderstanding of the Basel III requirements, and is subject tofinal regulatory clarity and rulemaking, model calibration andother final implementation guidance.32CITIGROUP – 2012 FIRST QUARTER 10-Q