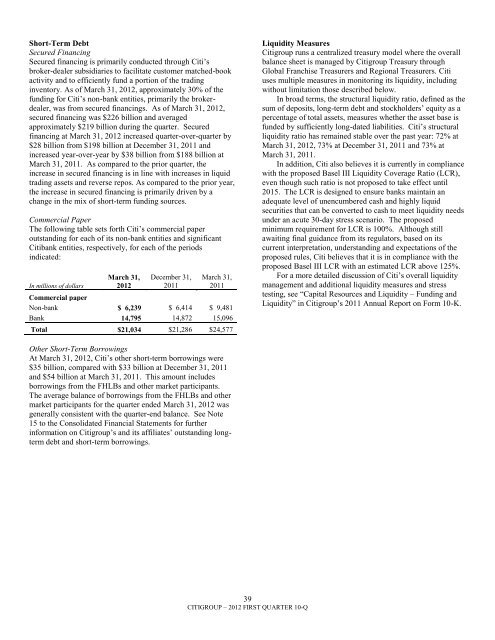
Short-Term DebtSecured FinancingSecured financing is primarily conducted through Citi‘sbroker-dealer subsidiaries to facilitate customer matched-bookactivity and to efficiently fund a portion of the tradinginventory. As of March 31, 2012, approximately 30% of thefunding for Citi‘s non-bank entities, primarily the brokerdealer,was from secured financings. As of March 31, 2012,secured financing was $226 <strong>billion</strong> and averagedapproximately $219 <strong>billion</strong> during the quarter. Securedfinancing at March 31, 2012 increased quarter-over-quarter by$28 <strong>billion</strong> from $198 <strong>billion</strong> at December 31, 2011 andincreased year-over-year by $38 <strong>billion</strong> from $188 <strong>billion</strong> atMarch 31, 2011. As compared to the prior quarter, theincrease in secured financing is in line with increases in liquidtrading assets and reverse repos. As compared to the prior year,the increase in secured financing is primarily driven by achange in the mix of short-term funding sources.Commercial PaperThe following table sets forth Citi‘s commercial paperoutstanding for each of its non-bank entities and significantCitibank entities, respectively, for each of the periodsindicated:In millions of dollarsMarch 31,2012December 31,2011March 31,2011Commercial paperNon-bank $ 6,239 $ 6,414 $ 9,481Bank 14,795 14,872 15,096Total $21,034 $21,286 $24,577Liquidity Measures<strong>Citigroup</strong> runs a centralized treasury model where the overallbalance sheet is managed by <strong>Citigroup</strong> Treasury throughGlobal Franchise Treasurers and Regional Treasurers. Citiuses multiple measures in monitoring its liquidity, includingwithout limitation those described below.In broad terms, the structural liquidity ratio, defined as thesum of deposits, long-term debt and stockholders‘ equity as apercentage of total assets, measures whether the asset base isfunded by sufficiently long-dated liabilities. Citi‘s structuralliquidity ratio has remained stable over the past year: 72% atMarch 31, 2012, 73% at December 31, 2011 and 73% atMarch 31, 2011.In addition, Citi also believes it is currently in compliancewith the proposed Basel III Liquidity Coverage Ratio (LCR),even though such ratio is not proposed to take effect until2015. The LCR is designed to ensure banks maintain anadequate level of unencumbered cash and highly liquidsecurities that can be converted to cash to meet liquidity needsunder an acute 30-day stress scenario. The proposedminimum requirement for LCR is 100%. Although stillawaiting final guidance from its regulators, based on itscurrent interpretation, understanding and expectations of theproposed rules, Citi believes that it is in compliance with theproposed Basel III LCR with an estimated LCR above 125%.For a more detailed discussion of Citi‘s overall liquiditymanagement and additional liquidity measures and stresstesting, see ―Capital Resources and Liquidity – Funding andLiquidity‖ in <strong>Citigroup</strong>‘s 2011 Annual Report on Form 10-K.Other Short-Term BorrowingsAt March 31, 2012, Citi‘s other short-term borrowings were$35 <strong>billion</strong>, compared with $33 <strong>billion</strong> at December 31, 2011and $54 <strong>billion</strong> at March 31, 2011. This amount includesborrowings from the FHLBs and other market participants.The average balance of borrowings from the FHLBs and othermarket participants for the quarter ended March 31, 2012 wasgenerally consistent with the quarter-end balance. See Note15 to the Consolidated Financial Statements for furtherinformation on <strong>Citigroup</strong>‘s and its affiliates‘ outstanding longtermdebt and short-term borrowings.39CITIGROUP – 2012 FIRST QUARTER 10-Q
Credit Ratings<strong>Citigroup</strong>‘s funding and liquidity, including without limitationits funding capacity, its ability to access the capital marketsand other sources of funds, as well as the cost of these funds,and its ability to maintain certain deposits, is partiallydependent on its credit ratings. The table below indicates theratings for <strong>Citigroup</strong>, Citibank, N.A. and <strong>Citigroup</strong> GlobalMarkets Inc. (a broker-dealer subsidiary of <strong>Citigroup</strong> Inc.) asof March 31, 2012.<strong>Citigroup</strong>’s Debt Ratings as of March 31, 2012<strong>Citigroup</strong> Inc./<strong>Citigroup</strong>Funding Inc. (1)40CITIGROUP – 2012 FIRST QUARTER 10-QCitibank, N.A.<strong>Citigroup</strong> GlobalMarkets Inc.SeniordebtCommercialpaperLongtermShorttermSeniordebtFitch Ratings (Fitch) A F1 A F1 NRMoody‘s Investors Service (Moody‘s) A3 P-2 A1 P-1 NRStandard & Poor‘s (S&P) A- A-2 A A-1 A(1) As a result of the <strong>Citigroup</strong> guarantee, the ratings of, and changes in ratings for, CFI are the same as those of <strong>Citigroup</strong>.NR Not rated.Recent Credit Rating DevelopmentsOn November 29, 2011, following its global review of thebanking industry under its revised bank criteria, S&Pdowngraded the issuer credit rating for <strong>Citigroup</strong> Inc. to ‗A-/A-2‘ from ‗A/A-1‘, and Citibank, N.A. to ‗A/A-1‘ from ‗A+/A-1‘.At the same time, S&P maintained a negative outlook on theratings. These ratings continue to receive two notches ofgovernment support uplift, reflecting S&P‘s view that the U.S.government is supportive to Citi. On December 15, 2011, Fitchannounced revised ratings resulting from its review ofgovernment support assumptions for 17 U.S. banks. This reviewresulted in a revision to the issuer credit ratings of <strong>Citigroup</strong> andCitibank, N.A. from ‗A+‘ to ‗A‘ and the short-term issuer ratingfrom ‗F1+‘ to ‗F1‘. Further, Fitch removed the ratings fromnegative watch, and the ratings outlook is stable.The above mentioned rating changes did not have amaterial impact on Citi‘s funding profile. Furthermore, forecastsof potential funding loss under various stress scenarios,including the above mentioned rating downgrades, did not occur.As previously disclosed, on February 15, 2012, Moody‘sannounced an industry-wide review of many European localbanks and 17 banks and securities firms with global capitalmarkets operations, including Citi. Underpinning this review isMoody‘s view that these firms face challenges that are not fullycaptured in their current ratings. Moody‘s placed the long- andshort-term ratings of Citibank, N.A. on review for downgrade aswell as the long-term rating of <strong>Citigroup</strong> Inc. The short-termrating of ‗P-2‘ at <strong>Citigroup</strong> Inc. was affirmed. It is not certainwhat the results of Moody‘s review will be, whether or to whatextent <strong>Citigroup</strong> or Citibank, N.A. will be impacted, or what, ifany, industry-wide impacts could occur as a result of Moody‘sreview of Citi and the industry as a whole.Potential Impacts of Ratings DowngradesRatings downgrades by Moody‘s, Fitch or S&P could havematerial impacts on <strong>Citigroup</strong>‘s and/or Citibank, N.A.‘s fundingand liquidity due to reduced funding capacity, includingderivatives triggers and exchange margin requirements, whichcould take the form of cash obligations and collateralrequirements. The following information is provided for thepurpose of analyzing the potential funding and liquidity impactto <strong>Citigroup</strong> and Citibank, N.A. of hypothetical, simultaneousratings downgrades across all three major rating agencies. Thisanalysis is subject to certain estimates, estimationmethodologies, judgments and uncertainties, including withoutlimitation those relating to potential ratings limitations certainentities may have with respect to permissible counterparties aswell as general subjective counterparty behavior (e.g., certaincorporate customers and trading counterparties could reevaluatetheir business relationships with Citi and limit thetrading of certain contracts or market instruments with Citi).Moreover, changes in counterparty behavior could impact Citi‘sfunding and liquidity as well as the results of operations ofcertain of its businesses. Accordingly, the actual impact to<strong>Citigroup</strong> or Citibank, N.A. is unpredictable and may differmaterially from the potential funding and liquidity impactsdescribed below.For additional information on the impact of credit ratingchanges on Citi and its applicable subsidiaries, see ―RiskFactors – Market and Economic Risks‖ in Citi‘s 2011 AnnualReport on Form 10-K.<strong>Citigroup</strong> Inc. and Citibank, N.A. – Potential DerivativeTriggers and Exchange Margin RequirementsAs of March 31, 2012, Citi estimates that a hypothetical twonotchdowngrade of the senior debt/long-term rating of<strong>Citigroup</strong> across all three major rating agencies could impact<strong>Citigroup</strong>‘s funding and liquidity due to derivative triggers andexchange margin requirements by approximately $2.1 <strong>billion</strong>.Of the $2.1 <strong>billion</strong>, $0.5 <strong>billion</strong> could result from a potentialtwo-notch downgrade by Moody‘s only. Other funding sources,such as secured financing transactions and other margin


