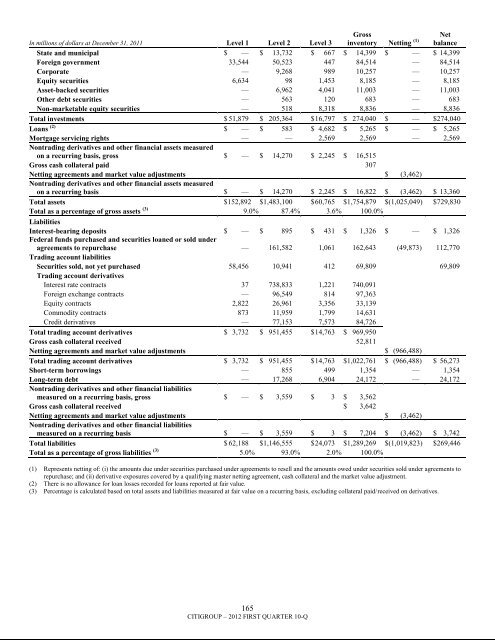
In millions of dollars at December 31, 2011 Level 1 Level 2 Level 3Grossinventory Netting (1) NetbalanceState and municipal $ — $ 13,732 $ 667 $ 14,399 $ — $ 14,399Foreign government 33,544 50,523 447 84,514 — 84,514Corporate — 9,268 989 10,257 — 10,257Equity securities 6,634 98 1,453 8,185 — 8,185Asset-backed securities — 6,962 4,041 11,003 — 11,003Other debt securities — 563 120 683 — 683Non-marketable equity securities — 518 8,318 8,836 — 8,836Total investments $ 51,879 $ 205,364 $ 16,797 $ 274,040 $ — $274,040Loans (2) $ — $ 583 $ 4,682 $ 5,265 $ — $ 5,265Mortgage servicing rights — — 2,569 2,569 — 2,569Nontrading derivatives and other financial assets measuredon a recurring basis, gross $ — $ 14,270 $ 2,245 $ 16,515Gross cash collateral paid 307Netting agreements and market value adjustments $ (3,462)Nontrading derivatives and other financial assets measuredon a recurring basis $ — $ 14,270 $ 2,245 $ 16,822 $ (3,462) $ 13,360Total assets $152,892 $1,483,100 $ 60,765 $1,754,879 $(1,025,049) $729,830Total as a percentage of gross assets (3) 9.0% 87.4% 3.6% 100.0%LiabilitiesInterest-bearing deposits $ — $ 895 $ 431 $ 1,326 $ — $ 1,326Federal funds purchased and securities loaned or sold underagreements to repurchase — 161,582 1,061 162,643 (49,873) 112,770Trading account liabilitiesSecurities sold, not yet purchased 58,456 10,941 412 69,809 69,809Trading account derivativesInterest rate contracts 37 738,833 1,221 740,091Foreign exchange contracts — 96,549 814 97,363Equity contracts 2,822 26,961 3,356 33,139Commodity contracts 873 11,959 1,799 14,631Credit derivatives — 77,153 7,573 84,726Total trading account derivatives $ 3,732 $ 951,455 $ 14,763 $ 969,950Gross cash collateral received 52,811Netting agreements and market value adjustments $ (966,488)Total trading account derivatives $ 3,732 $ 951,455 $ 14,763 $1,022,761 $ (966,488) $ 56,273Short-term borrowings — 855 499 1,354 — 1,354Long-term debt — 17,268 6,904 24,172 — 24,172Nontrading derivatives and other financial liabilitiesmeasured on a recurring basis, gross $ — $ 3,559 $ 3 $ 3,562Gross cash collateral received $ 3,642Netting agreements and market value adjustments $ (3,462)Nontrading derivatives and other financial liabilitiesmeasured on a recurring basis $ — $ 3,559 $ 3 $ 7,204 $ (3,462) $ 3,742Total liabilities $ 62,188 $1,146,555 $ 24,073 $1,289,269 $(1,019,823) $269,446Total as a percentage of gross liabilities (3) 5.0% 93.0% 2.0% 100.0%(1) Represents netting of: (i) the amounts due under securities purchased under agreements to resell and the amounts owed under securities sold under agreements torepurchase; and (ii) derivative exposures covered by a qualifying master netting agreement, cash collateral and the market value adjustment.(2) There is no allowance for loan losses recorded for loans reported at fair value.(3) Percentage is calculated based on total assets and liabilities measured at fair value on a recurring basis, excluding collateral paid/received on derivatives.165CITIGROUP – 2012 FIRST QUARTER 10-Q
Changes in Level 3 Fair Value CategoryThe following tables present the changes in the Level 3 fairvalue category for the three months ended March 31, 2012 andMarch 31, 2011. The Company classifies financial instrumentsin Level 3 of the fair value hierarchy when there is reliance on atleast one significant unobservable input to the valuation model.In addition to these unobservable inputs, the valuation modelsfor Level 3 financial instruments typically also rely on a numberof inputs that are readily observable either directly or indirectly.Thus, the gains and losses presented below include changes inthe fair value related to both observable and unobservable inputs.The Company often hedges positions with offsettingpositions that are classified in a different level. For example, thegains and losses for assets and liabilities in the Level 3 categorypresented in the tables below do not reflect the effect ofoffsetting losses and gains on hedging instruments that havebeen classified by the Company in the Level 1 and Level 2categories. In addition, the Company hedges items classified inthe Level 3 category with instruments also classified in Level 3of the fair value hierarchy. The effects of these hedges arepresented gross in the following tables.In millions of dollarsDec. 31,2011Net realized/unrealizedgains (losses) includedinPrincipaltransactions Other (1)(2)TransfersintoLevel 3UnrealizedTransfersout ofLevel 3 Purchases Issuances Sales SettlementsMar. 31.2012gains(losses)still held (3)AssetsFed funds sold and securitiesborrowed or purchased underagreements to resell $ 4,701 $ 33 $ — $ 25 $ (262) $ — $ — $ — $ — $ 4,497 $ 32Trading securitiesTrading mortgage-backedsecuritiesU.S. government-sponsoredagency guaranteed $ 861 $ 50 $ — $ 379 $ (127) $ 183 $ 31 $ (225) $ (37) $ 1,115 $ 22Prime 759 46 — 5 (103) 354 — (316) (1) 744 11Alt-A 165 18 — 3 (42) 69 — (107) — 106 (3)Subprime 465 (50) — 20 (20) 201 — (240) (1) 375 1Non-U.S. residential 120 5 — 2 (15) 68 — (58) — 122 3Commercial 618 (67) — 36 (108) 211 — (142) — 548 2Total trading mortgage-backedsecurities $ 2,988 $ 2 $ — $ 445 $ (415) $ 1,086 $ 31 $ (1,088) $ (39) $ 3,010 $ 36U.S. Treasury and federalagency securitiesU.S. Treasury $ — $ — $ — $ — $ — $ — $ — $ — $ — $ — $ —Agency obligations 3 — — — — — — (3) — — —Total U.S. Treasury andfederal agency securities $ 3 $ — $ — $ — $ — $ — $ — $ (3) $ — $ — $ —State and municipal $ 252 $ (3) $ — $ — $ — $ 22 $ — $ (48) $ — $ 223 $ (4)Foreign government 521 3 — 2 (263) 710 — (140) — 833 4Corporate 3,240 119 — 327 (125) 1,496 — (595) (699) 3,763 121Equity securities 244 4 — 18 (9) 78 — (120) (24) 191 (3)Asset-backed securities 5,801 335 — 17 (36) 2,651 — (3,054) (59) 5,655 66Other debt securities 2,209 (40) — 154 (65) 904 — (520) (55) 2,587 (22)Total trading securities $15,258 $ 420 $ — $ 963 $ (913) $ 6,947 $ 31 $ (5,568) $ (876) $ 16,262 $ 198Derivatives, net (4)Interest rate contracts 726 (217) — 342 (17) 199 — (129) (213) 691 (456)Foreign exchange contracts (33) 97 — (5) (8) 129 — (107) (17) 56 29Equity contracts (1,737) 474 — 3 436 134 — (175) (212) (1,077) (135)Commodity contracts (934) 74 — (5) 9 45 — (68) 20 (859) 2Credit derivatives 1,728 (1,235) — (204) (53) 111 — (10) (109) 228 (1,030)Total derivatives, net (4) $ (250) $ (807) $ — $ 131 $ 367 $ 618 $ — $ (489) $ (531) $ (961) $ (1,590)InvestmentsMortgage-backed securitiesU.S. government-sponsoredagency guaranteed $ 679 $ — $ 9 $ — $ (641) $ 885 $ — $ — $ — $ 932 $ 4Prime 8 — — — (6) — — — — 2 —Alt-A — — — — — — — — — — —Subprime — — — — — — — — — — —Commercial — — — — — 6 — — — 6 —Total investment mortgagebackeddebt securities $ 687 $ — $ 9 $ — $ (647) $ 891 $ — $ — $ — $ 940 $ 4166CITIGROUP – 2012 FIRST QUARTER 10-Q