Section 23A was approximately $20 <strong>billion</strong>, provided the fundsare collateralized appropriately.DepositsAs of March 31, 2012, approximately 80% of Citi‘s banksubsidiaries are funded by deposits. Citi continued to focus onmaintaining a geographically diverse retail and corporatedeposits base that stood at $906 <strong>billion</strong> at March 31, 2012, up5%, or $40 <strong>billion</strong>, from the prior-year period, and included 7%year-over-year growth in Citicorp. The increase in depositsyear-over-year was largely due to higher deposit volumes ineach of Citicorp‘s deposit-taking businesses, includingTransaction Services, Securities and Banking (primarily thePrivate Bank) and Global Consumer Banking. Year-over-yeardeposit growth occurred in North America, Europe and Asia, ascustomer demand continued a ―flight to quality‖ given theuncertain macroeconomic environment. As of March 31, 2012,approximately 61% of Citi‘s deposits were located outside ofthe United States. These increases in deposits in Citicorp werepartially offset by a continued decrease in deposits in CitiHoldings.In addition to deposit growth, the composition of Citi‘sdeposits, within Securities and Banking (primarily the PrivateBank), Transaction Services and Global Consumer Banking, hasshifted year-over-year. Specifically, time deposits, where ratesare fixed for the term of the deposit and have generally lowermargins, became a smaller proportion of the deposit base,whereas operating balances (which Citi defines as checking andsavings accounts for individuals, as well as cash managementaccounts for corporations) became a larger proportion ofdeposits. Citi continues to believe that operating accountsprovide wider margins and exhibit retentive behavior. At March31, 2012, operating balances represented 76% and 73% of totaldeposits in each of Global Consumer Banking and Citi‘sinstitutional businesses, respectively. In addition, operatingbalances represented 74% of Citicorp‘s deposit base as of March31, 2012, compared to 71% as of March 31, 2011 and 62% atMarch 31, 2010.Deposits can be interest-bearing or non-interest-bearing. OfCiti‘s $906 <strong>billion</strong> of deposits as of March 31, 2012, $183<strong>billion</strong> were non-interest-bearing, compared to $144 <strong>billion</strong> atMarch 31, 2011. The remainder, or $723 <strong>billion</strong>, was interestbearing,compared to $722 <strong>billion</strong> at March 31, 2011.While Citi‘s deposits have grown year-over-year, Citi‘soverall cost of funds on deposits decreased, reflecting the lowrate environment as well as Citi‘s ability to lower price pointsthat widens its margins given the high levels of customerliquidity while still remaining competitive. Citi‘s average rateon total deposits was 0.94% at March 31, 2012, compared with0.96% at March 31, 2011. Excluding the impact of the higherFDIC assessment effective beginning in the second quarter of2011 and deposit insurance, the average rate on Citi‘s totaldeposits was 0.76% at March 31, 2012, compared with 0.85% atMarch 31, 2011. Citi would, however, expect to see pressure onthese rates due to competitive pricing in certain regions or asinterest rates increase.Long-Term DebtLong-term debt (generally defined as original maturities of oneyear or more) represents the most significant component ofCiti‘s funding for its non-bank entities, or 35% of the funding inthe non-bank entities as of March 31, 2012. The vast majorityof this funding is comprised of senior term debt, along withsubordinated instruments and trust preferred securities. Longtermdebt is an important funding source for Citi‘s non-bankentities due in part to its multi-year maturity structure. Theweighted average maturities of long-term debt (greater than oneyear remaining life) issued by <strong>Citigroup</strong>, CFI, CGMHI andCitibank, N.A., excluding trust preferred securities, wasapproximately 6.9 years at March 31, 2012, compared to 6.5years at March 31, 2011.The following table sets forth <strong>Citigroup</strong>‘s total long-termdebt outstanding for the periods indicated:In <strong>billion</strong>sof dollarsMarch 31,2012December 31,2011March 31,2011Non-bank $240.4 $247.0 $267.4Bank (1)(2) 70.7 76.5 109.1Total $311.1 (3) $323.5 $376.5(1) Collateralized advances from the FHLB were approximately $11.0 <strong>billion</strong>,$11.0 <strong>billion</strong>, and $17.5 <strong>billion</strong>, respectively, at March 31, 2012,December 31, 2011, and March 31, 2011. These advances are reflected inthe table above.(2) Includes long-term debt related to consolidated VIEs of approximately$43.4 <strong>billion</strong>, $48.8 <strong>billion</strong>, and $64.3 <strong>billion</strong>, respectively, at March 31,2012, December 31, 2011, and March 31, 2011. The majority of theseVIEs relate to the Citibank Credit Card Master Trust and the CitibankOMNI Master Trust.(3) Of this amount, approximately $34.5 <strong>billion</strong> maturing during the remainderof 2012 is guaranteed by the FDIC under the Temporary LiquidityGuarantee Program (TLGP).As set forth in the table above, Citi‘s overall long-term debthas decreased by approximately $65 <strong>billion</strong> year-over-year. Inthe non-bank, the year-over-year decrease was primarily due toTLGP run-off that was not refinanced. In the bank entities, thedecrease was also driven by TLGP run-off as well as FHLBreductions and the maturing of credit card securitization debt,particularly as Citi has grown its overall deposit base. Citicurrently expects a continued decline in its overall long-termdebt over 2012, particularly within its bank entities.Given its liquidity resources as of March 31, 2012, Citi has,and may continue to, consider opportunities to repurchase itslong-term and short-term debt pursuant to open marketpurchases, tender offers or other means. Such repurchasesfurther decrease Citi‘s overall funding costs. During the firstquarter of 2012, Citi repurchased an aggregate of approximately$1.7 <strong>billion</strong> of its outstanding long-term and short-term debt,primarily pursuant to open market purchases.37CITIGROUP – 2012 FIRST QUARTER 10-Q
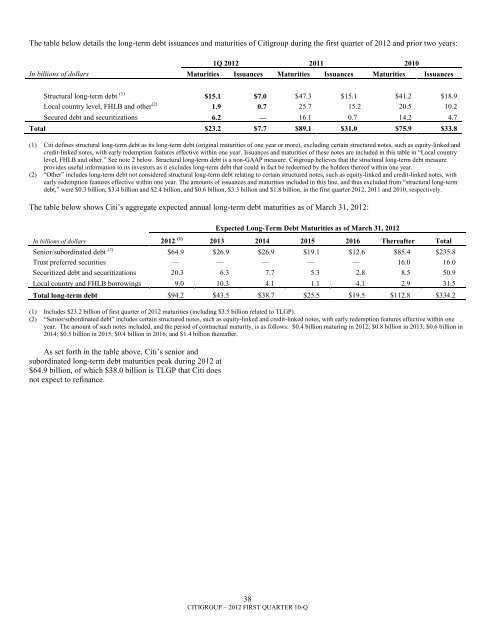
The table below details the long-term debt issuances and maturities of <strong>Citigroup</strong> during the first quarter of 2012 and prior two years:1Q 2012 2011 2010In <strong>billion</strong>s of dollars Maturities Issuances Maturities Issuances Maturities IssuancesStructural long-term debt (1) $15.1 $7.0 $4<strong>7.3</strong> $15.1 $41.2 $18.9Local country level, FHLB and other (2) 1.9 0.7 25.7 15.2 20.5 10.2Secured debt and securitizations 6.2 — 16.1 0.7 14.2 4.7Total $23.2 $7.7 $89.1 $31.0 $75.9 $33.8(1) Citi defines structural long-term debt as its long-term debt (original maturities of one year or more), excluding certain structured notes, such as equity-linked andcredit-linked notes, with early redemption features effective within one year. Issuances and maturities of these notes are included in this table in ―Local countrylevel, FHLB and other.‖ See note 2 below. Structural long-term debt is a non-GAAP measure. <strong>Citigroup</strong> believes that the structural long-term debt measureprovides useful information to its investors as it excludes long-term debt that could in fact be redeemed by the holders thereof within one year.(2) ―Other‖ includes long-term debt not considered structural long-term debt relating to certain structured notes, such as equity-linked and credit-linked notes, withearly redemption features effective within one year. The amounts of issuances and maturities included in this line, and thus excluded from ―structural long-termdebt,‖ were $0.3 <strong>billion</strong>, $3.4 <strong>billion</strong> and $2.4 <strong>billion</strong>, and $0.6 <strong>billion</strong>, $3.3 <strong>billion</strong> and $1.8 <strong>billion</strong>, in the first quarter 2012, 2011 and 2010, respectively.The table below shows Citi‘s aggregate expected annual long-term debt maturities as of March 31, 2012:Expected Long-Term Debt Maturities as of March 31, 2012In <strong>billion</strong>s of dollars 2012 (1) 2013 2014 2015 2016 Thereafter TotalSenior/subordinated debt (2) $64.9 $26.9 $26.9 $19.1 $12.6 $85.4 $235.8Trust preferred securities — — — — — 16.0 16.0Securitized debt and securitizations 20.3 6.3 7.7 5.3 2.8 8.5 50.9Local country and FHLB borrowings 9.0 10.3 4.1 1.1 4.1 2.9 31.5Total long-term debt $94.2 $43.5 $38.7 $25.5 $19.5 $112.8 $334.2(1) Includes $23.2 <strong>billion</strong> of first quarter of 2012 maturities (including $3.5 <strong>billion</strong> related to TLGP).(2) ―Senior/subordinated debt‖ includes certain structured notes, such as equity-linked and credit-linked notes, with early redemption features effective within oneyear. The amount of such notes included, and the period of contractual maturity, is as follows: $0.4 <strong>billion</strong> maturing in 2012; $0.8 <strong>billion</strong> in 2013; $0.6 <strong>billion</strong> in2014; $0.5 <strong>billion</strong> in 2015; $0.4 <strong>billion</strong> in 2016; and $1.4 <strong>billion</strong> thereafter.As set forth in the table above, Citi‘s senior andsubordinated long-term debt maturities peak during 2012 at$64.9 <strong>billion</strong>, of which $38.0 <strong>billion</strong> is TLGP that Citi doesnot expect to refinance.38CITIGROUP – 2012 FIRST QUARTER 10-Q