

7.3 billion - Citigroup
7.3 billion - Citigroup
7.3 billion - Citigroup

Create successful ePaper yourself
Turn your PDF publications into a flip-book with our unique Google optimized e-Paper software.
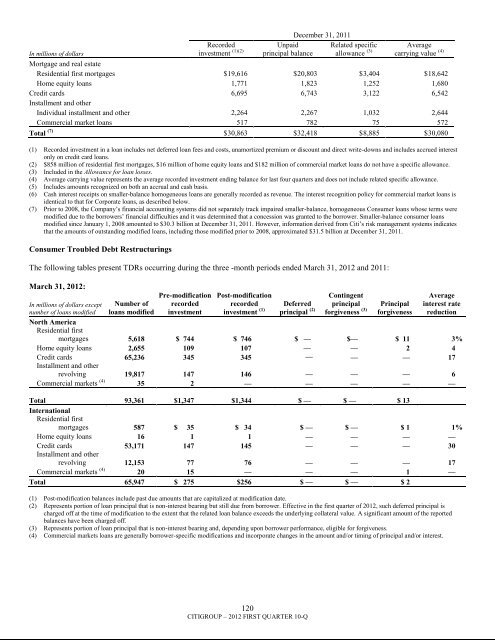
In millions of dollarsRecordedinvestment (1)(2)Unpaidprincipal balanceDecember 31, 2011Related specificallowance (3)Averagecarrying value (4)Mortgage and real estateResidential first mortgages $ 19,616 $ 20,803 $ 3,404 $ 18,642Home equity loans 1,771 1,823 1,252 1,680Credit cards 6,695 6,743 3,122 6,542Installment and otherIndividual installment and other 2,264 2,267 1,032 2,644Commercial market loans 517 782 75 572Total (7) $ 30,863 $ 32,418 $ 8,885 $ 30,080(1) Recorded investment in a loan includes net deferred loan fees and costs, unamortized premium or discount and direct write-downs and includes accrued interestonly on credit card loans.(2) $858 million of residential first mortgages, $16 million of home equity loans and $182 million of commercial market loans do not have a specific allowance.(3) Included in the Allowance for loan losses.(4) Average carrying value represents the average recorded investment ending balance for last four quarters and does not include related specific allowance.(5) Includes amounts recognized on both an accrual and cash basis.(6) Cash interest receipts on smaller-balance homogeneous loans are generally recorded as revenue. The interest recognition policy for commercial market loans isidentical to that for Corporate loans, as described below.(7) Prior to 2008, the Company‘s financial accounting systems did not separately track impaired smaller-balance, homogeneous Consumer loans whose terms weremodified due to the borrowers‘ financial difficulties and it was determined that a concession was granted to the borrower. Smaller-balance consumer loansmodified since January 1, 2008 amounted to $30.3 <strong>billion</strong> at December 31, 2011. However, information derived from Citi‘s risk management systems indicatesthat the amounts of outstanding modified loans, including those modified prior to 2008, approximated $31.5 <strong>billion</strong> at December 31, 2011.Consumer Troubled Debt RestructuringsThe following tables present TDRs occurring during the three -month periods ended March 31, 2012 and 2011:March 31, 2012:Pre-modificationrecordedinvestmentPost-modificationrecordedinvestment (1)Contingentprincipalforgiveness (3)Averageinterest ratereductionIn millions of dollars exceptnumber of loans modifiedNumber ofloans modifiedDeferredprincipal (2)PrincipalforgivenessNorth AmericaResidential firstmortgages 5,618 $ 744 $ 746 $ — $— $ 11 3%Home equity loans 2,655 109 107 — — 2 4Credit cards 65,236 345 345 — — — 17Installment and otherrevolving 19,817 147 146 — — — 6Commercial markets (4) 35 2 — — — — —Total 93,361 $1,347 $1,344 $ — $ — $ 13InternationalResidential firstmortgages 587 $ 35 $ 34 $ — $ — $ 1 1%Home equity loans 16 1 1 — — — —Credit cards 53,171 147 145 — — — 30Installment and otherrevolving 12,153 77 76 — — — 17Commercial markets (4) 20 15 — — — 1 —Total 65,947 $ 275 $256 $ — $ — $ 2(1) Post-modification balances include past due amounts that are capitalized at modification date.(2) Represents portion of loan principal that is non-interest bearing but still due from borrower. Effective in the first quarter of 2012, such deferred principal ischarged off at the time of modification to the extent that the related loan balance exceeds the underlying collateral value. A significant amount of the reportedbalances have been charged off.(3) Represents portion of loan principal that is non-interest bearing and, depending upon borrower performance, eligible for forgiveness.(4) Commercial markets loans are generally borrower-specific modifications and incorporate changes in the amount and/or timing of principal and/or interest.120CITIGROUP – 2012 FIRST QUARTER 10-Q


