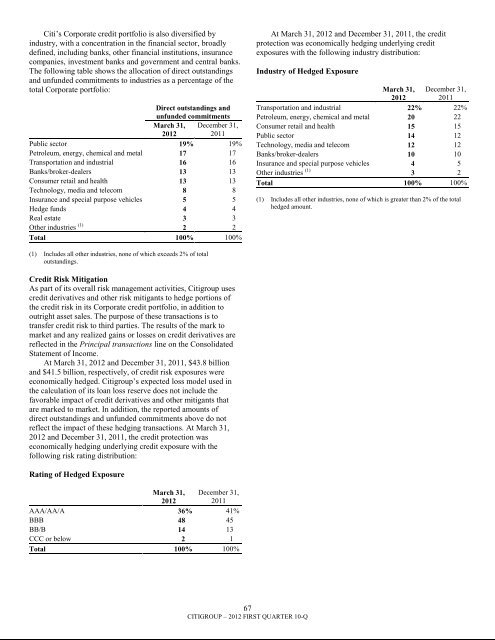
Citi‘s Corporate credit portfolio is also diversified byindustry, with a concentration in the financial sector, broadlydefined, including banks, other financial institutions, insurancecompanies, investment banks and government and central banks.The following table shows the allocation of direct outstandingsand unfunded commitments to industries as a percentage of thetotal Corporate portfolio:Direct outstandings andunfunded commitmentsMarch 31,2012December 31,2011Public sector 19% 19%Petroleum, energy, chemical and metal 17 17Transportation and industrial 16 16Banks/broker-dealers 13 13Consumer retail and health 13 13Technology, media and telecom 8 8Insurance and special purpose vehicles 5 5Hedge funds 4 4Real estate 3 3Other industries (1) 2 2Total 100% 100%At March 31, 2012 and December 31, 2011, the creditprotection was economically hedging underlying creditexposures with the following industry distribution:Industry of Hedged ExposureMarch 31,2012December 31,2011Transportation and industrial 22% 22%Petroleum, energy, chemical and metal 20 22Consumer retail and health 15 15Public sector 14 12Technology, media and telecom 12 12Banks/broker-dealers 10 10Insurance and special purpose vehicles 4 5Other industries (1) 3 2Total 100% 100%(1) Includes all other industries, none of which is greater than 2% of the totalhedged amount.(1) Includes all other industries, none of which exceeds 2% of totaloutstandings.Credit Risk MitigationAs part of its overall risk management activities, <strong>Citigroup</strong> usescredit derivatives and other risk mitigants to hedge portions ofthe credit risk in its Corporate credit portfolio, in addition tooutright asset sales. The purpose of these transactions is totransfer credit risk to third parties. The results of the mark tomarket and any realized gains or losses on credit derivatives arereflected in the Principal transactions line on the ConsolidatedStatement of Income.At March 31, 2012 and December 31, 2011, $43.8 <strong>billion</strong>and $41.5 <strong>billion</strong>, respectively, of credit risk exposures wereeconomically hedged. <strong>Citigroup</strong>‘s expected loss model used inthe calculation of its loan loss reserve does not include thefavorable impact of credit derivatives and other mitigants thatare marked to market. In addition, the reported amounts ofdirect outstandings and unfunded commitments above do notreflect the impact of these hedging transactions. At March 31,2012 and December 31, 2011, the credit protection waseconomically hedging underlying credit exposure with thefollowing risk rating distribution:Rating of Hedged ExposureMarch 31,2012December 31,2011AAA/AA/A 36% 41%BBB 48 45BB/B 14 13CCC or below 2 1Total 100% 100%67CITIGROUP – 2012 FIRST QUARTER 10-Q
EXPOSURE TO COMMERCIAL REAL ESTATEThrough their business activities and as capital marketsparticipants, ICG and, to a lesser extent, SAP and BAM, incurexposures that are directly or indirectly tied to the commercialreal estate (CRE) market. In addition, each of LCL and GCBhold loans that are collateralized by CRE. These exposures arerepresented primarily by the following three categories:(1) Assets held at fair value included approximately $4.8<strong>billion</strong> at March 31, 2012, of which approximately $3.6 <strong>billion</strong>are securities, loans and other items linked to CRE that arecarried at fair value as Trading account assets, approximately$1.1 <strong>billion</strong> are securities backed by CRE carried at fair value asavailable-for-sale (AFS) investments, and approximately $0.1<strong>billion</strong> are other exposures classified as Other assets. Changesin fair value for these trading account assets are reported incurrent earnings, while for AFS investments change in fair valueare reported in Accumulated other comprehensive income withcredit-related other-than-temporary impairments reported incurrent earnings.These exposures are generally classified as Level 2 or Level3 in the fair value hierarchy. Generally, the portfolio classifiedas Level 2 relates to exposures in markets with observableliquidity, while the Level 3 portfolio represents exposures withreduced liquidity. See Note 19 to the Consolidated FinancialStatements.(2) Assets held at amortized cost include approximately$1.2 <strong>billion</strong> of securities classified as held-to-maturity (HTM)and approximately $26.1 <strong>billion</strong> of loans and commitments eachas of March 31, 2012. HTM securities are accounted for atamortized cost, subject to an other-than-temporary impairmentevaluation. Loans and commitments are recorded at amortizedcost. The impact of changes in credit is reflected in thecalculation of the allowance for loan losses and in net creditlosses.(3) Equity and other investments include approximately$3.6 <strong>billion</strong> of equity and other investments (such as limitedpartner fund investments) at March 31, 2012 that are accountedfor under the equity method, which recognizes gains or lossesbased on the investor‘s share of the net income (loss) of theinvestee.The following table provides a summary of <strong>Citigroup</strong>‘sglobal CRE funded and unfunded exposures at March 31, 2012and December 31, 2011:In <strong>billion</strong>s of dollarsMarch 31,2012December 31,2011Institutional Clients GroupCRE exposures carried at fair value(including AFS securities) $ 4.0 $ 4.6Loans and unfunded commitments 20.2 19.9HTM securities 1.2 1.2Equity method investments 3.4 3.4Total ICG $28.8 $29.1Special Asset PoolCRE exposures carried at fair value(including AFS securities) $ 0.4 $ 0.4Loans and unfunded commitments 2.0 2.4Equity method investments 0.2 0.2Total SAP $ 2.6 $ 3.0Global Consumer BankingLoans and unfunded commitments $ 3.2 $ 2.9Local Consumer LendingLoans and unfunded commitments $ 0.7 $ 1.0Brokerage and Asset ManagementCRE exposures carried at fair value $ 0.4 $ 0.5Total <strong>Citigroup</strong> $35.7 $36.5The above table represents the vast majority of Citi‘s directexposure to CRE. There may be other transactions that haveindirect exposures to CRE that are not reflected in this table.68CITIGROUP – 2012 FIRST QUARTER 10-Q


