

7.3 billion - Citigroup
7.3 billion - Citigroup
7.3 billion - Citigroup

You also want an ePaper? Increase the reach of your titles
YUMPU automatically turns print PDFs into web optimized ePapers that Google loves.
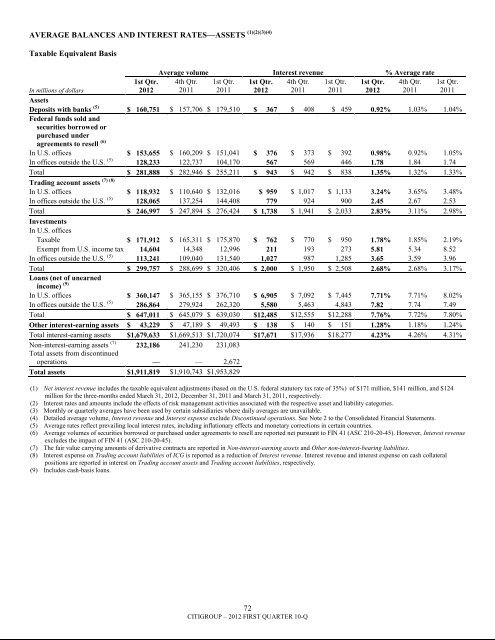
AVERAGE BALANCES AND INTEREST RATES—ASSETS (1)(2)(3)(4)Taxable Equivalent BasisIn millions of dollars1st Qtr.2012Average volume Interest revenue % Average rate4th Qtr. 1st Qtr. 1st Qtr. 4th Qtr. 1st Qtr. 1st Qtr. 4th Qtr.2011 2011 2012 2011 2011 2012 2011AssetsDeposits with banks (5) $ 160,751 $ 157,706 $ 179,510 $ 367 $ 408 $ 459 0.92% 1.03% 1.04%Federal funds sold andsecurities borrowed orpurchased underagreements to resell (6)In U.S. offices $ 153,655 $ 160,209 $ 151,041 $ 376 $ 373 $ 392 0.98% 0.92% 1.05%In offices outside the U.S. (5) 128,233 122,737 104,170 567 569 446 1.78 1.84 1.74Total $ 281,888 $ 282,946 $ 255,211 $ 943 $ 942 $ 838 1.35% 1.32% 1.33%(7) (8)Trading account assetsIn U.S. offices $ 118,932 $ 110,640 $ 132,016 $ 959 $ 1,017 $ 1,133 3.24% 3.65% 3.48%In offices outside the U.S. (5) 128,065 137,254 144,408 779 924 900 2.45 2.67 2.53Total $ 246,997 $ 247,894 $ 276,424 $ 1,738 $ 1,941 $ 2,033 2.83% 3.11% 2.98%InvestmentsIn U.S. officesTaxable $ 171,912 $ 165,311 $ 175,870 $ 762 $ 770 $ 950 1.78% 1.85% 2.19%Exempt from U.S. income tax 14,604 14,348 12,996 211 193 273 5.81 5.34 8.52In offices outside the U.S. (5) 113,241 109,040 131,540 1,027 987 1,285 3.65 3.59 3.96Total $ 299,757 $ 288,699 $ 320,406 $ 2,000 $ 1,950 $ 2,508 2.68% 2.68% 3.17%Loans (net of unearnedincome) (9)In U.S. offices $ 360,147 $ 365,155 $ 376,710 $ 6,905 $ 7,092 $ 7,445 7.71% 7.71% 8.02%In offices outside the U.S. (5) 286,864 279,924 262,320 5,580 5,463 4,843 7.82 7.74 7.49Total $ 647,011 $ 645,079 $ 639,030 $12,485 $12,555 $12,288 7.76% 7.72% 7.80%Other interest-earning assets $ 43,229 $ 47,189 $ 49,493 $ 138 $ 140 $ 151 1.28% 1.18% 1.24%Total interest-earning assets $1,679,633 $1,669,513 $1,720,074 $17,671 $17,936 $18,277 4.23% 4.26% 4.31%Non-interest-earning assets (7) 232,186 241,230 231,083Total assets from discontinuedoperations — — 2,672Total assets $1,911,819 $1,910,743 $1,953,829(1) Net interest revenue includes the taxable equivalent adjustments (based on the U.S. federal statutory tax rate of 35%) of $171 million, $141 million, and $124million for the three-months ended March 31, 2012, December 31, 2011 and March 31, 2011, respectively.(2) Interest rates and amounts include the effects of risk management activities associated with the respective asset and liability categories.(3) Monthly or quarterly averages have been used by certain subsidiaries where daily averages are unavailable.(4) Detailed average volume, Interest revenue and Interest expense exclude Discontinued operations. See Note 2 to the Consolidated Financial Statements.(5) Average rates reflect prevailing local interest rates, including inflationary effects and monetary corrections in certain countries.(6) Average volumes of securities borrowed or purchased under agreements to resell are reported net pursuant to FIN 41 (ASC 210-20-45). However, Interest revenueexcludes the impact of FIN 41 (ASC 210-20-45).(7) The fair value carrying amounts of derivative contracts are reported in Non-interest-earning assets and Other non-interest-bearing liabilities.(8) Interest expense on Trading account liabilities of ICG is reported as a reduction of Interest revenue. Interest revenue and interest expense on cash collateralpositions are reported in interest on Trading account assets and Trading account liabilities, respectively.(9) Includes cash-basis loans.1st Qtr.201172CITIGROUP – 2012 FIRST QUARTER 10-Q


