The majority of ARS continue to be classified as Level 3.Alt-A mortgage securitiesThe Company classifies its Alt-A mortgage securities as heldto-maturity,available-for-sale and trading investments. Thesecurities classified as trading and available-for-sale arerecorded at fair value with changes in fair value reported incurrent earnings and AOCI, respectively. For these purposes,Citi defines Alt-A mortgage securities as non-agency residentialmortgage-backed securities (RMBS) where (1) the underlyingcollateral has weighted average FICO scores between 680 and720 or (2) for instances where FICO scores are greater than 720,RMBS have 30% or less of the underlying collateral composedof full documentation loans.Similar to the valuation methodologies used for othertrading securities and trading loans, the Company generallydetermines the fair values of Alt-A mortgage securities utilizinginternal valuation techniques. Fair value estimates from internalvaluation techniques are verified, where possible, to pricesobtained from independent vendors. Consensus data providerscompile prices from various sources. Where available, theCompany may also make use of quoted prices for recent tradingactivity in securities with the same or similar characteristics tothe security being valued.The valuation techniques used for Alt-A mortgagesecurities, as with other mortgage exposures, are price-basedand discounted cash flows. The primary market-derived input isyield. Cash flows are based on current collateral performancewith prepayment rates and loss projections reflective of currenteconomic conditions of housing price change, unemploymentrates, interest rates, borrower attributes and other marketindicators.Alt-A mortgage securities that are valued using thesemethods are generally classified as Level 2. However, Alt-Amortgage securities backed by Alt-A mortgages of lower qualityor subordinated tranches in the capital structure are mostlyclassified as Level 3 due to the reduced liquidity that exists forsuch positions, which reduces the reliability of prices availablefrom independent sources.to commercial real estate valued using these methodologies aregenerally classified as either Level 2 or Level 3. Positions areclassified as Level 3 as a result of reduced liquidity in themarket for such exposures.The fair value of investments in entities that holdcommercial real estate loans or commercial real estate directly isdetermined using a similar methodology to that used for othernon-public investments in real estate held by the S&B business.The Company uses an established process for determining thefair value of such securities, using commonly accepted valuationtechniques, including the use of earnings multiples based oncomparable public securities, industry-specific non-earningsbasedmultiples and discounted cash flow models. Indetermining the fair value of such investments, the Companyalso considers events, such as a proposed sale of the investeecompany, initial public offerings, equity issuances, or otherobservable transactions. Investments in entities that holdcommercial real estate exposures are valued using thesemethodologies and are generally classified as either Level 2 orLevel 3.Commercial real estate exposure<strong>Citigroup</strong> reports a number of different exposures linked tocommercial real estate at fair value with changes in fair valuereported in earnings, including securities, loans and investmentsin entities that hold commercial real estate loans or commercialreal estate directly. The Company also reports securities backedby commercial real estate as available-for-sale investments,which are carried at fair value with changes in fair valuereported in AOCI.Similar to the valuation methodologies used for othertrading securities and trading loans, the Company generallydetermines the fair value of securities and loans linked tocommercial real estate utilizing internal valuation techniqueswhich incorporate assumptions regarding defaults, recoveriesand collateral values, among other inputs. Fair value estimatesfrom internal valuation techniques are verified, where possible,to prices obtained from independent vendors. Consensus dataproviders compile prices from various sources. Where available,the Company may also make use of quoted prices for recenttrading activity in securities or loans with the same or similarcharacteristics to that being valued. Securities and loans linked161CITIGROUP – 2012 FIRST QUARTER 10-Q
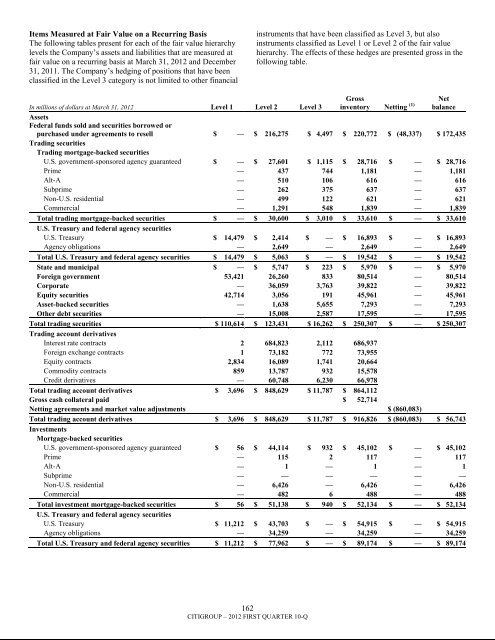
Items Measured at Fair Value on a Recurring BasisThe following tables present for each of the fair value hierarchylevels the Company‘s assets and liabilities that are measured atfair value on a recurring basis at March 31, 2012 and December31, 2011. The Company‘s hedging of positions that have beenclassified in the Level 3 category is not limited to other financialinstruments that have been classified as Level 3, but alsoinstruments classified as Level 1 or Level 2 of the fair valuehierarchy. The effects of these hedges are presented gross in thefollowing table.In millions of dollars at March 31, 2012 Level 1 Level 2 Level 3Grossinventory Netting (1) NetbalanceAssetsFederal funds sold and securities borrowed orpurchased under agreements to resell $ — $ 216,275 $ 4,497 $ 220,772 $ (48,337) $ 172,435Trading securitiesTrading mortgage-backed securitiesU.S. government-sponsored agency guaranteed $ — $ 27,601 $ 1,115 $ 28,716 $ — $ 28,716Prime — 437 744 1,181 — 1,181Alt-A — 510 106 616 — 616Subprime — 262 375 637 — 637Non-U.S. residential — 499 122 621 — 621Commercial — 1,291 548 1,839 — 1,839Total trading mortgage-backed securities $ — $ 30,600 $ 3,010 $ 33,610 $ — $ 33,610U.S. Treasury and federal agency securitiesU.S. Treasury $ 14,479 $ 2,414 $ — $ 16,893 $ — $ 16,893Agency obligations — 2,649 — 2,649 — 2,649Total U.S. Treasury and federal agency securities $ 14,479 $ 5,063 $ — $ 19,542 $ — $ 19,542State and municipal $ — $ 5,747 $ 223 $ 5,970 $ — $ 5,970Foreign government 53,421 26,260 833 80,514 — 80,514Corporate — 36,059 3,763 39,822 — 39,822Equity securities 42,714 3,056 191 45,961 — 45,961Asset-backed securities — 1,638 5,655 7,293 — 7,293Other debt securities — 15,008 2,587 17,595 — 17,595Total trading securities $ 110,614 $ 123,431 $ 16,262 $ 250,307 $ — $ 250,307Trading account derivativesInterest rate contracts 2 684,823 2,112 686,937Foreign exchange contracts 1 73,182 772 73,955Equity contracts 2,834 16,089 1,741 20,664Commodity contracts 859 13,787 932 15,578Credit derivatives — 60,748 6,230 66,978Total trading account derivatives $ 3,696 $ 848,629 $ 11,787 $ 864,112Gross cash collateral paid $ 52,714Netting agreements and market value adjustments $ (860,083)Total trading account derivatives $ 3,696 $ 848,629 $ 11,787 $ 916,826 $ (860,083) $ 56,743InvestmentsMortgage-backed securitiesU.S. government-sponsored agency guaranteed $ 56 $ 44,114 $ 932 $ 45,102 $ — $ 45,102Prime — 115 2 117 — 117Alt-A — 1 — 1 — 1Subprime — — — — — —Non-U.S. residential — 6,426 — 6,426 — 6,426Commercial — 482 6 488 — 488Total investment mortgage-backed securities $ 56 $ 51,138 $ 940 $ 52,134 $ — $ 52,134U.S. Treasury and federal agency securitiesU.S. Treasury $ 11,212 $ 43,703 $ — $ 54,915 $ — $ 54,915Agency obligations — 34,259 — 34,259 — 34,259Total U.S. Treasury and federal agency securities $ 11,212 $ 77,962 $ — $ 89,174 $ — $ 89,174162CITIGROUP – 2012 FIRST QUARTER 10-Q