7.3 billion - Citigroup
7.3 billion - Citigroup
7.3 billion - Citigroup
You also want an ePaper? Increase the reach of your titles
YUMPU automatically turns print PDFs into web optimized ePapers that Google loves.
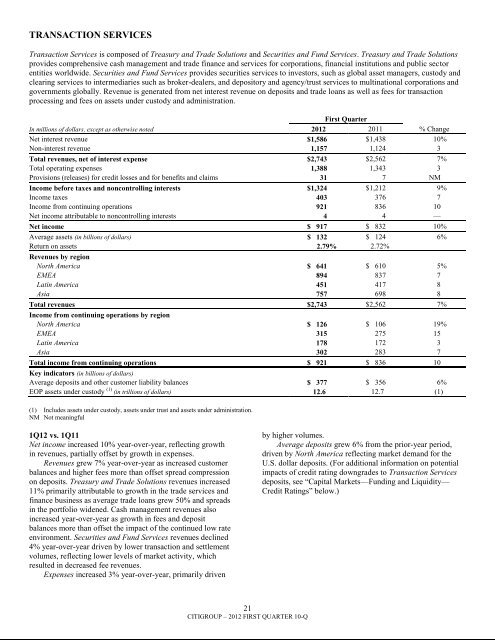
TRANSACTION SERVICESTransaction Services is composed of Treasury and Trade Solutions and Securities and Fund Services. Treasury and Trade Solutionsprovides comprehensive cash management and trade finance and services for corporations, financial institutions and public sectorentities worldwide. Securities and Fund Services provides securities services to investors, such as global asset managers, custody andclearing services to intermediaries such as broker-dealers, and depository and agency/trust services to multinational corporations andgovernments globally. Revenue is generated from net interest revenue on deposits and trade loans as well as fees for transactionprocessing and fees on assets under custody and administration.First QuarterIn millions of dollars, except as otherwise noted 2012 2011 % ChangeNet interest revenue $1,586 $1,438 10%Non-interest revenue 1,157 1,124 3Total revenues, net of interest expense $2,743 $2,562 7%Total operating expenses 1,388 1,343 3Provisions (releases) for credit losses and for benefits and claims 31 7 NMIncome before taxes and noncontrolling interests $1,324 $1,212 9%Income taxes 403 376 7Income from continuing operations 921 836 10Net income attributable to noncontrolling interests 4 4 —Net income $ 917 $ 832 10%Average assets (in <strong>billion</strong>s of dollars) $ 132 $ 124 6%Return on assets 2.79% 2.72%Revenues by regionNorth America $ 641 $ 610 5%EMEA 894 837 7Latin America 451 417 8Asia 757 698 8Total revenues $2,743 $2,562 7%Income from continuing operations by regionNorth America $ 126 $ 106 19%EMEA 315 275 15Latin America 178 172 3Asia 302 283 7Total income from continuing operations $ 921 $ 836 10Key indicators (in <strong>billion</strong>s of dollars)Average deposits and other customer liability balances $ 377 $ 356 6%EOP assets under custody (1) (in trillions of dollars) 12.6 12.7 (1)(1) Includes assets under custody, assets under trust and assets under administration.NM Not meaningful1Q12 vs. 1Q11Net income increased 10% year-over-year, reflecting growthin revenues, partially offset by growth in expenses.Revenues grew 7% year-over-year as increased customerbalances and higher fees more than offset spread compressionon deposits. Treasury and Trade Solutions revenues increased11% primarily attributable to growth in the trade services andfinance business as average trade loans grew 50% and spreadsin the portfolio widened. Cash management revenues alsoincreased year-over-year as growth in fees and depositbalances more than offset the impact of the continued low rateenvironment. Securities and Fund Services revenues declined4% year-over-year driven by lower transaction and settlementvolumes, reflecting lower levels of market activity, whichresulted in decreased fee revenues.Expenses increased 3% year-over-year, primarily drivenby higher volumes.Average deposits grew 6% from the prior-year period,driven by North America reflecting market demand for theU.S. dollar deposits. (For additional information on potentialimpacts of credit rating downgrades to Transaction Servicesdeposits, see ―Capital Markets—Funding and Liquidity—Credit Ratings‖ below.)21CITIGROUP – 2012 FIRST QUARTER 10-Q


