- Page 1 and 2:
UNITED STATESSECURITIES AND EXCHANG
- Page 3 and 4: CITIGROUP INCFIRST QUARTER 2012 - F
- Page 5 and 6: As described above, Citigroup is ma
- Page 7 and 8: The Consumer allowance for loan los
- Page 9 and 10: SUMMARY OF SELECTED FINANCIAL DATA
- Page 11 and 12: CITIGROUP REVENUESFirst QuarterIn m
- Page 13 and 14: GLOBAL CONSUMER BANKINGGlobal Consu
- Page 15 and 16: EMEA REGIONAL CONSUMER BANKINGEMEA
- Page 17 and 18: ASIA REGIONAL CONSUMER BANKINGAsia
- Page 19 and 20: [THIS PAGE INTENTIONALLY LEFT BLANK
- Page 21 and 22: 1Q12 vs. 1Q11Net income of $1.2 bil
- Page 23 and 24: CITI HOLDINGSCiti Holdings contains
- Page 25 and 26: LOCAL CONSUMER LENDINGLocal Consume
- Page 27 and 28: SPECIAL ASSET POOLSpecial Asset Poo
- Page 29 and 30: BALANCE SHEET REVIEWThe following s
- Page 31 and 32: transactions, see ―Capital Resour
- Page 33 and 34: CAPITAL RESOURCES AND LIQUIDITYCAPI
- Page 35 and 36: Common Stockholders’ EquityCitigr
- Page 37 and 38: FUNDING AND LIQUIDITYOverviewCiti
- Page 39 and 40: The table below details the long-te
- Page 41 and 42: Credit RatingsCitigroup‘s funding
- Page 43 and 44: OFF-BALANCE-SHEET ARRANGEMENTSCitig
- Page 45 and 46: Details of Credit Loss Experience1s
- Page 47 and 48: Non-Accrual LoansIn millions of dol
- Page 49 and 50: Renegotiated LoansThe following tab
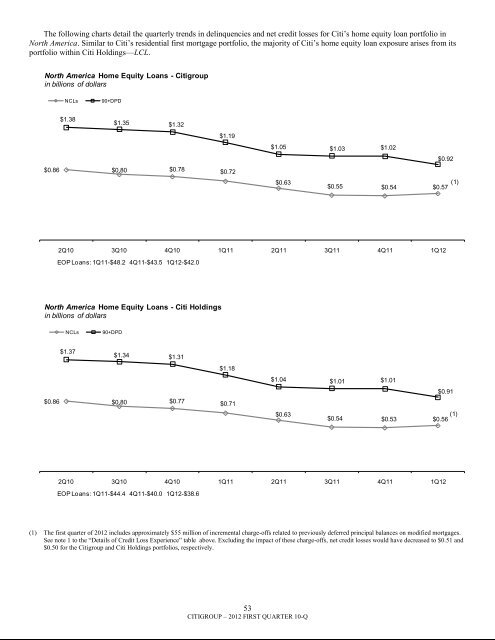
- Page 51 and 52: North America Residential First Mor
- Page 53: loans exiting foreclosure inventory
- Page 57 and 58: Citi will account for the refinanci
- Page 59 and 60: Legacy S&B Securitizations (princip
- Page 61 and 62: In addition to the amounts set fort
- Page 63 and 64: North America Citi Retail Services
- Page 65 and 66: Consumer Loan Net Credit Losses and
- Page 67 and 68: CORPORATE LOAN DETAILSFor corporate
- Page 69 and 70: EXPOSURE TO COMMERCIAL REAL ESTATET
- Page 71 and 72: Value at Risk for Trading Portfolio
- Page 73 and 74: AVERAGE BALANCES AND INTEREST RATES
- Page 75 and 76: (10) Excludes hybrid financial inst
- Page 77 and 78: ANALYSIS OF CHANGES IN INTEREST EXP
- Page 79 and 80: GIIPSGross funded credit exposure t
- Page 81 and 82: Credit Default SwapsCiti buys and s
- Page 84 and 85: CREDIT DERIVATIVESCitigroup makes m
- Page 87 and 88: DISCLOSURE CONTROLS ANDPROCEDURESCi
- Page 89 and 90: FINANCIAL STATEMENTS AND NOTES TABL
- Page 91 and 92: CONSOLIDATED STATEMENT OF COMPREHEN
- Page 93 and 94: CONSOLIDATED BALANCE SHEET(Continue
- Page 95 and 96: CONSOLIDATED STATEMENT OF CASH FLOW
- Page 97 and 98: ACCOUNTING CHANGESPresentation of C
- Page 99 and 100: 2. DISCONTINUED OPERATIONSSale of E
- Page 101 and 102: 4. INTEREST REVENUE AND EXPENSEFor
- Page 103 and 104: period. The 2012 deferred cash awar
- Page 105 and 106:
9. EARNINGS PER SHAREThe following
- Page 107 and 108:
11. INVESTMENTSOverviewIn millions
- Page 109 and 110:
The following table presents the am
- Page 111 and 112:
During the first quarter of 2011, t
- Page 113 and 114:
Evaluating Investments for Other-Th
- Page 115 and 116:
Recognition and Measurement of OTTI
- Page 117 and 118:
12. LOANSCitigroup loans are report
- Page 119 and 120:
Consumer Credit Scores (FICO)In the
- Page 121 and 122:
In millions of dollarsRecordedinves
- Page 123 and 124:
Corporate LoansCorporate loans repr
- Page 125 and 126:
Corporate Loans Credit Quality Indi
- Page 127 and 128:
Corporate Troubled Debt Restructuri
- Page 129 and 130:
14. GOODWILL AND INTANGIBLE ASSETSG
- Page 131 and 132:
15. DEBTShort-Term BorrowingsShort-
- Page 133 and 134:
16. CHANGES IN ACCUMULATED OTHER CO
- Page 135 and 136:
THIS PAGE INTENTIONALLY LEFT BLANK.
- Page 137 and 138:
In millions of dollars As of Decemb
- Page 139 and 140:
Funding Commitments for Significant
- Page 141 and 142:
Credit Card Securitizations—Citic
- Page 143 and 144:
The range in the key assumptions is
- Page 145 and 146:
The market for MSRs is not sufficie
- Page 147 and 148:
investors in the form of funded not
- Page 149 and 150:
are tendered and the Company (in it
- Page 151 and 152:
18. DERIVATIVES ACTIVITIESIn the or
- Page 153 and 154:
Derivative Mark-to-Market (MTM) Rec
- Page 155 and 156:
Key aspects of achieving ASC 815 he
- Page 157 and 158:
Credit DerivativesA credit derivati
- Page 159 and 160:
19. FAIR VALUE MEASUREMENTASC 820-1
- Page 161 and 162:
The key inputs depend upon the type
- Page 163 and 164:
Items Measured at Fair Value on a R
- Page 165 and 166:
In millions of dollars at December
- Page 167 and 168:
Changes in Level 3 Fair Value Categ
- Page 169 and 170:
Net realized/unrealizedgains (losse
- Page 171 and 172:
— Purchases of Corporate debt tra
- Page 173 and 174:
Fair Value(in millions) Methodology
- Page 175 and 176:
Items Measured at Fair Value on a N
- Page 177 and 178:
20. FAIR VALUE ELECTIONSThe Company
- Page 179 and 180:
The following table provides inform
- Page 181 and 182:
The following table provides inform
- Page 183 and 184:
Financial standby letters of credit
- Page 185 and 186:
Value-Transfer NetworksThe Company
- Page 187 and 188:
Credit Commitments and Lines of Cre
- Page 189 and 190:
Mortgage-Backed Securities and CDO
- Page 191 and 192:
Condensed Consolidating Statements
- Page 193 and 194:
Condensed Consolidating Balance She
- Page 195 and 196:
Condensed Consolidating Statements
- Page 197 and 198:
LEGAL PROCEEDINGSFor a discussion o
- Page 199 and 200:
Item 6. ExhibitsSee Exhibit Index.1
- Page 201:
EXHIBIT INDEX3.01.1 Restated Certif