

7.3 billion - Citigroup
7.3 billion - Citigroup
7.3 billion - Citigroup

You also want an ePaper? Increase the reach of your titles
YUMPU automatically turns print PDFs into web optimized ePapers that Google loves.
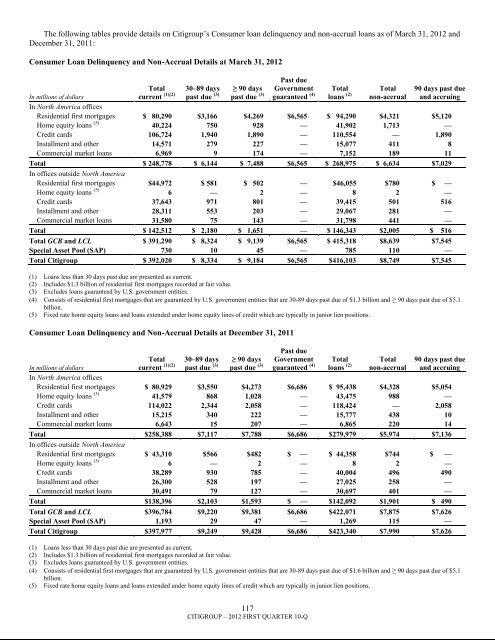
The following tables provide details on <strong>Citigroup</strong>‘s Consumer loan delinquency and non-accrual loans as of March 31, 2012 andDecember 31, 2011:Consumer Loan Delinquency and Non-Accrual Details at March 31, 2012Totalcurrent (1)(2)30–89 dayspast due (3)≥ 90 dayspast due (3)Past dueGovernmentguaranteed (4)Totalloans (2)Totalnon-accrual90 days past dueand accruingIn millions of dollarsIn North America officesResidential first mortgages $ 80,290 $3,166 $4,269 $6,565 $ 94,290 $4,321 $5,120Home equity loans (5) 40,224 750 928 — 41,902 1,713 —Credit cards 106,724 1,940 1,890 — 110,554 — 1,890Installment and other 14,571 279 227 — 15,077 411 8Commercial market loans 6,969 9 174 — 7,152 189 11Total $ 248,778 $ 6,144 $ 7,488 $6,565 $ 268,975 $ 6,634 $7,029In offices outside North AmericaResidential first mortgages $44,972 $ 581 $ 502 — $46,055 $780 $ —Home equity loans (5) 6 — 2 — 8 2 —Credit cards 37,643 971 801 — 39,415 501 516Installment and other 28,311 553 203 — 29,067 281 —Commercial market loans 31,580 75 143 — 31,798 441 —Total $ 142,512 $ 2,180 $ 1,651 — $ 146,343 $2,005 $ 516Total GCB and LCL $ 391,290 $ 8,324 $ 9,139 $6,565 $ 415,318 $8,639 $7,545Special Asset Pool (SAP) 730 10 45 — 785 110 —Total <strong>Citigroup</strong> $ 392,020 $ 8,334 $ 9,184 $6,565 $416,103 $8,749 $7,545(1) Loans less than 30 days past due are presented as current.(2) Includes $1.3 <strong>billion</strong> of residential first mortgages recorded at fair value.(3) Excludes loans guaranteed by U.S. government entities.(4) Consists of residential first mortgages that are guaranteed by U.S. government entities that are 30-89 days past due of $1.3 <strong>billion</strong> and ≥ 90 days past due of $5.1<strong>billion</strong>.(5) Fixed rate home equity loans and loans extended under home equity lines of credit which are typically in junior lien positions.Consumer Loan Delinquency and Non-Accrual Details at December 31, 2011Totalcurrent (1)(2)30–89 dayspast due (3)≥ 90 dayspast due (3)Past dueGovernmentguaranteed (4)Totalloans (2)Totalnon-accrual90 days past dueand accruingIn millions of dollarsIn North America officesResidential first mortgages $ 80,929 $3,550 $4,273 $6,686 $ 95,438 $4,328 $5,054Home equity loans (5) 41,579 868 1,028 — 43,475 988 —Credit cards 114,022 2,344 2,058 — 118,424 — 2,058Installment and other 15,215 340 222 — 15,777 438 10Commercial market loans 6,643 15 207 — 6,865 220 14Total $258,388 $7,117 $7,788 $6,686 $279,979 $5,974 $7,136In offices outside North AmericaResidential first mortgages $ 43,310 $566 $482 $ — $ 44,358 $744 $ —Home equity loans (5) 6 — 2 — 8 2 —Credit cards 38,289 930 785 — 40,004 496 490Installment and other 26,300 528 197 — 27,025 258 —Commercial market loans 30,491 79 127 — 30,697 401 —Total $138,396 $2,103 $1,593 $ — $142,092 $1,901 $ 490Total GCB and LCL $396,784 $9,220 $9,381 $6,686 $422,071 $7,875 $7,626Special Asset Pool (SAP) 1,193 29 47 — 1,269 115 —Total <strong>Citigroup</strong> $397,977 $9,249 $9,428 $6,686 $423,340 $7,990 $7,626(1) Loans less than 30 days past due are presented as current.(2) Includes $1.3 <strong>billion</strong> of residential first mortgages recorded at fair value.(3) Excludes loans guaranteed by U.S. government entities.(4) Consists of residential first mortgages that are guaranteed by U.S. government entities that are 30-89 days past due of $1.6 <strong>billion</strong> and ≥ 90 days past due of $5.1<strong>billion</strong>.(5) Fixed rate home equity loans and loans extended under home equity lines of credit which are typically in junior lien positions.117CITIGROUP – 2012 FIRST QUARTER 10-Q


