Components of Capital Under Current Regulatory GuidelinesMarch 31,2012December 31,2011In millions of dollarsTier 1 Common Capital<strong>Citigroup</strong> common stockholders‘ equity $181,508 $ 177,494Less: Net unrealized losses on securities available-for-sale, net of tax (1)(2) (809) (35)Less: Net unrealized loss on available-for-sale equity securities, net of tax 79 —Less: Accumulated net losses on cash flow hedges, net of tax (2,600) (2,820)Less: Pension liability adjustment, net of tax (3) (4,372) (4,282)Less: Cumulative effect included in fair value of financial liabilities attributable to the change inown creditworthiness, net of tax (4) 480 1,265Less: Disallowed deferred tax assets (5) 36,136 37,980Less: Intangible assets:Goodwill 25,810 25,413Other disallowed intangible assets 4,472 4,550Other (560) (569)Total Tier 1 Common Capital $121,752 $ 114,854Tier 1 CapitalQualifying perpetual preferred stock $ 312 $ 312Qualifying mandatorily redeemable securities of subsidiary trusts 15,913 15,929Qualifying noncontrolling interests 862 779Total Tier 1 Capital $138,839 $ 131,874Tier 2 CapitalAllowance for credit losses (6) $ 12,410 $ 12,423Qualifying subordinated debt (7) 20,507 20,429Net unrealized pretax gains on available-for-sale equity securities (1) — 658Total Tier 2 Capital $ 32,917 $ 33,510Total Capital (Tier 1 Capital + Tier 2 Capital) $171,756 $ 165,384Risk-weighted assets (RWA) (8) $973,730 $ 973,369(1) Tier 1 Capital excludes net unrealized gains (losses) on available-for-sale debt securities and net unrealized gains on available-for-sale equity securities withreadily determinable fair values, in accordance with risk-based capital guidelines. In arriving at Tier 1 Capital, banking organizations are required to deduct netunrealized losses on available-for-sale equity securities with readily determinable fair values, net of tax. Banking organizations are permitted to include in Tier 2Capital up to 45% of net unrealized pretax gains on available-for-sale equity securities with readily determinable fair values.(2) In addition, includes the net amount of unamortized loss on held-to-maturity (HTM) securities. This amount relates to securities which were previouslytransferred from AFS to HTM, and non-credit-related factors such as changes in interest rates and liquidity spreads for HTM securities with other-than-temporaryimpairment.(3) The Federal Reserve Board granted interim capital relief for the impact of ASC 715-20, Compensation—Retirement Benefits—Defined Benefits Plans (formerlySFAS 158).(4) The impact of changes in <strong>Citigroup</strong>‘s own creditworthiness in valuing financial liabilities for which the fair value option has been elected is excluded from Tier 1Capital, in accordance with risk-based capital guidelines.(5) Of Citi‘s approximately $52 <strong>billion</strong> of net deferred tax assets at March 31, 2012, approximately $11 <strong>billion</strong> of such assets were includable without limitation inregulatory capital pursuant to risk-based capital guidelines, while approximately $36 <strong>billion</strong> of such assets exceeded the limitation imposed by these guidelinesand, as ―disallowed deferred tax assets,‖ were deducted in arriving at Tier 1 Capital. <strong>Citigroup</strong>‘s approximately $5 <strong>billion</strong> of other net deferred tax assets primarilyrepresented effects of the pension liability and cash flow hedges adjustments, which are permitted to be excluded prior to deriving the amount of net deferred taxassets subject to limitation under the guidelines.(6) Includable up to 1.25% of risk-weighted assets. Any excess allowance for credit losses is deducted in arriving at risk-weighted assets.(7) Includes qualifying subordinated debt in an amount not exceeding 50% of Tier 1 Capital.(8) Includes risk-weighted credit equivalent amounts, net of applicable bilateral netting agreements, of $65 <strong>billion</strong> for interest rate, commodity and equity derivativecontracts, foreign exchange contracts, and credit derivatives as of March 31, 2012, compared with $67 <strong>billion</strong> as of December 31, 2011. Market risk equivalentassets included in risk-weighted assets amounted to $40.7 <strong>billion</strong> at March 31, 2012 and $46.8 <strong>billion</strong> at December 31, 2011. Risk-weighted assets also include theeffect of certain other off-balance-sheet exposures, such as unused lending commitments and letters of credit, and reflect deductions such as certain intangibleassets and any excess allowance for credit losses.33CITIGROUP – 2012 FIRST QUARTER 10-Q
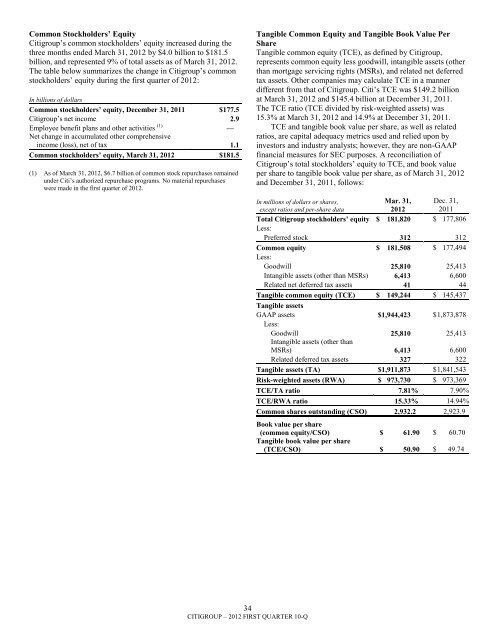
Common Stockholders’ Equity<strong>Citigroup</strong>‘s common stockholders‘ equity increased during thethree months ended March 31, 2012 by $4.0 <strong>billion</strong> to $181.5<strong>billion</strong>, and represented 9% of total assets as of March 31, 2012.The table below summarizes the change in <strong>Citigroup</strong>‘s commonstockholders‘ equity during the first quarter of 2012:In <strong>billion</strong>s of dollarsCommon stockholders’ equity, December 31, 2011 $177.5<strong>Citigroup</strong>‘s net income 2.9Employee benefit plans and other activities (1) —Net change in accumulated other comprehensiveincome (loss), net of tax 1.1Common stockholders’ equity, March 31, 2012 $181.5(1) As of March 31, 2012, $6.7 <strong>billion</strong> of common stock repurchases remainedunder Citi‘s authorized repurchase programs. No material repurchaseswere made in the first quarter of 2012.Tangible Common Equity and Tangible Book Value PerShareTangible common equity (TCE), as defined by <strong>Citigroup</strong>,represents common equity less goodwill, intangible assets (otherthan mortgage servicing rights (MSRs), and related net deferredtax assets. Other companies may calculate TCE in a mannerdifferent from that of <strong>Citigroup</strong>. Citi‘s TCE was $149.2 <strong>billion</strong>at March 31, 2012 and $145.4 <strong>billion</strong> at December 31, 2011.The TCE ratio (TCE divided by risk-weighted assets) was15.3% at March 31, 2012 and 14.9% at December 31, 2011.TCE and tangible book value per share, as well as relatedratios, are capital adequacy metrics used and relied upon byinvestors and industry analysts; however, they are non-GAAPfinancial measures for SEC purposes. A reconciliation of<strong>Citigroup</strong>‘s total stockholders‘ equity to TCE, and book valueper share to tangible book value per share, as of March 31, 2012and December 31, 2011, follows:In millions of dollars or shares,except ratios and per-share dataMar. 31,2012Dec. 31,2011Total <strong>Citigroup</strong> stockholders’ equity $ 181,820 $ 177,806Less:Preferred stock 312 312Common equity $ 181,508 $ 177,494Less:Goodwill 25,810 25,413Intangible assets (other than MSRs) 6,413 6,600Related net deferred tax assets 41 44Tangible common equity (TCE) $ 149,244 $ 145,437Tangible assetsGAAP assets $1,944,423 $ 1,873,878Less:Goodwill 25,810 25,413Intangible assets (other thanMSRs) 6,413 6,600Related deferred tax assets 327 322Tangible assets (TA) $1,911,873 $ 1,841,543Risk-weighted assets (RWA) $ 973,730 $ 973,369TCE/TA ratio 7.81% 7.90%TCE/RWA ratio 15.33% 14.94%Common shares outstanding (CSO) 2,932.2 2,923.9Book value per share(common equity/CSO) $ 61.90 $ 60.70Tangible book value per share(TCE/CSO) $ 50.90 $ 49.7434CITIGROUP – 2012 FIRST QUARTER 10-Q