In millions of dollars at March 31, 2012 Level 1 Level 2 Level 3Grossinventory Netting (1) NetbalanceState and municipal $ — $ 13,462 $ 682 $ 14,144 $ — $ 14,144Foreign government 34,910 53,992 375 89,277 — 89,277Corporate — 10,912 1,062 11,974 — 11,974Equity securities 453 644 1,326 2,423 — 2,423Asset-backed securities — 7,773 3,073 10,846 — 10,846Other debt securities — 555 55 610 — 610Non-marketable equity securities — 555 8,287 8,842 — 8,842Total investments $ 46,631 $ 216,993 $ 15,800 $ 279,424 $ — $ 279,424Loans (2) $ — $ 466 $ 4,278 $ 4,744 $ — $ 4,744Mortgage servicing rights — — 2,691 2,691 — 2,691Nontrading derivatives and other financial assets measuredon a recurring basis, gross $ — $ 10,620 $ 2,322 $ 12,942Gross cash collateral paid $ 144Netting agreements and market value adjustments $ (3,673)Nontrading derivatives and other financial assets measuredon a recurring basis $ — $ 10,620 $ 2,322 $ 13,086 $ (3,673) $ 9,413Total assets $ 160,941 $ 1,416,414 $ 57,637 $ 1,687,850 $ (912,093) $ 775,757Total as a percentage of gross assets (3) 9.9% 86.6% 3.5% 100.0%LiabilitiesInterest-bearing deposits — 869 458 1,327 — 1,327Federal funds purchased and securities loaned or sold underagreements to repurchase — 184,883 1,025 185,908 (48,337) 137,571Trading account liabilitiesSecurities sold, not yet purchased 71,850 10,175 177 82,202 82,202Trading account derivativesInterest rate contracts 5 667,925 1,421 669,351Foreign exchange contracts 2 78,126 716 78,844Equity contracts 3,131 29,698 2,818 35,647Commodity contracts 889 14,349 1,791 17,029Credit derivatives — 57,485 6,002 63,487Total trading account derivatives $ 4,027 $ 847,583 $ 12,748 $ 864,358Gross cash collateral received 44,972Netting agreements and market value adjustments $ (855,576)Total trading account derivatives $ 4,027 $ 847,583 $ 12,748 $ 909,330 $ (855,576) $ 53,754Short-term borrowings — 794 423 1,217 — 1,217Long-term debt — 20,181 6,519 26,700 — 26,700Nontrading derivatives and other financial liabilitiesmeasured on a recurring basis, gross $ — $ 2,561 $ 2 $ 2,563Gross cash collateral received $ 4,249Netting agreements and market value adjustments $ (3,673)Nontrading derivatives and other financial liabilitiesmeasured on a recurring basis — 2,561 2 6,812 (3,673) 3,139Total liabilities $ 75,877 $ 1,067,046 $ 21,352 $ 1,213,496 $ (907,586) $ 305,910Total as a percentage of gross liabilities (3) 6.5% 91.7% 1.8% 100.0%(1) Represents netting of: (i) the amounts due under securities purchased under agreements to resell and the amounts owed under securities sold under agreements torepurchase; and (ii) derivative exposures covered by a qualifying master netting agreement, cash collateral and the market value adjustment.(2) There is no allowance for loan losses recorded for loans reported at fair value.(3) Percentage is calculated based on total assets and liabilities measured at fair value on a recurring basis, excluding collateral paid/received on derivatives.163CITIGROUP – 2012 FIRST QUARTER 10-Q
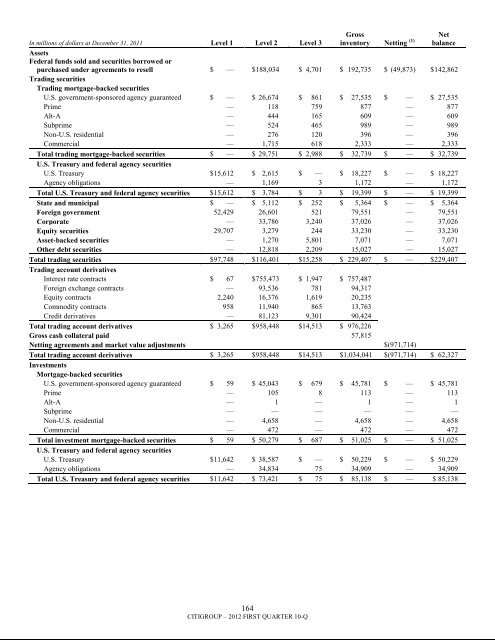
In millions of dollars at December 31, 2011 Level 1 Level 2 Level 3Grossinventory Netting (1) NetbalanceAssetsFederal funds sold and securities borrowed orpurchased under agreements to resell $ — $188,034 $ 4,701 $ 192,735 $ (49,873) $ 142,862Trading securitiesTrading mortgage-backed securitiesU.S. government-sponsored agency guaranteed $ — $ 26,674 $ 861 $ 27,535 $ — $ 27,535Prime — 118 759 877 — 877Alt-A — 444 165 609 — 609Subprime — 524 465 989 — 989Non-U.S. residential — 276 120 396 — 396Commercial — 1,715 618 2,333 — 2,333Total trading mortgage-backed securities $ — $ 29,751 $ 2,988 $ 32,739 $ — $ 32,739U.S. Treasury and federal agency securitiesU.S. Treasury $15,612 $ 2,615 $ — $ 18,227 $ — $ 18,227Agency obligations — 1,169 3 1,172 — 1,172Total U.S. Treasury and federal agency securities $15,612 $ 3,784 $ 3 $ 19,399 $ — $ 19,399State and municipal $ — $ 5,112 $ 252 $ 5,364 $ — $ 5,364Foreign government 52,429 26,601 521 79,551 — 79,551Corporate — 33,786 3,240 37,026 — 37,026Equity securities 29,707 3,279 244 33,230 — 33,230Asset-backed securities — 1,270 5,801 7,071 — 7,071Other debt securities — 12,818 2,209 15,027 — 15,027Total trading securities $97,748 $116,401 $15,258 $ 229,407 $ — $ 229,407Trading account derivativesInterest rate contracts $ 67 $755,473 $ 1,947 $ 757,487Foreign exchange contracts — 93,536 781 94,317Equity contracts 2,240 16,376 1,619 20,235Commodity contracts 958 11,940 865 13,763Credit derivatives — 81,123 9,301 90,424Total trading account derivatives $ 3,265 $958,448 $14,513 $ 976,226Gross cash collateral paid 57,815Netting agreements and market value adjustments $(971,714)Total trading account derivatives $ 3,265 $958,448 $14,513 $1,034,041 $(971,714) $ 62,327InvestmentsMortgage-backed securitiesU.S. government-sponsored agency guaranteed $ 59 $ 45,043 $ 679 $ 45,781 $ — $ 45,781Prime — 105 8 113 — 113Alt-A — 1 — 1 — 1Subprime — — — — — —Non-U.S. residential — 4,658 — 4,658 — 4,658Commercial — 472 — 472 — 472Total investment mortgage-backed securities $ 59 $ 50,279 $ 687 $ 51,025 $ — $ 51,025U.S. Treasury and federal agency securitiesU.S. Treasury $11,642 $ 38,587 $ — $ 50,229 $ — $ 50,229Agency obligations — 34,834 75 34,909 — 34,909Total U.S. Treasury and federal agency securities $11,642 $ 73,421 $ 75 $ 85,138 $ — $ 85,138164CITIGROUP – 2012 FIRST QUARTER 10-Q