

7.3 billion - Citigroup
7.3 billion - Citigroup
7.3 billion - Citigroup

Create successful ePaper yourself
Turn your PDF publications into a flip-book with our unique Google optimized e-Paper software.
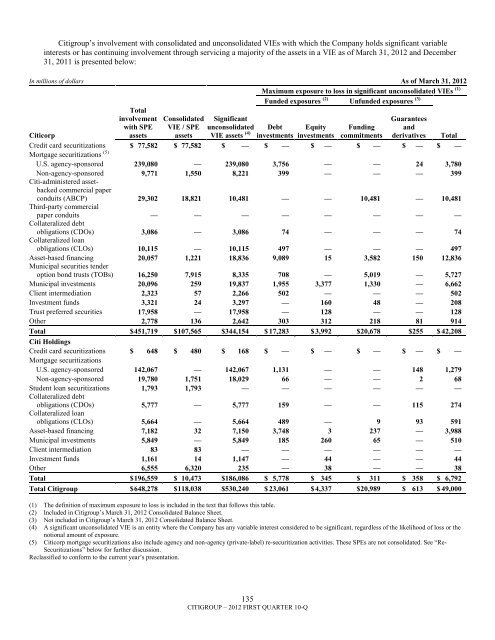
<strong>Citigroup</strong>‘s involvement with consolidated and unconsolidated VIEs with which the Company holds significant variableinterests or has continuing involvement through servicing a majority of the assets in a VIE as of March 31, 2012 and December31, 2011 is presented below:In millions of dollars As of March 31, 2012Maximum exposure to loss in significant unconsolidated VIEs (1)Totalinvolvementwith SPEassetsConsolidatedVIE / SPEassetsSignificantunconsolidatedVIE assets (4)Funded exposures (2) Unfunded exposures (3)GuaranteesandderivativesDebt Equity FundingCiticorpinvestments investments commitmentsTotalCredit card securitizations $ 77,582 $ 77,582 $ — $ — $ — $ — $ — $ —Mortgage securitizations (5)U.S. agency-sponsored 239,080 — 239,080 3,756 — — 24 3,780Non-agency-sponsored 9,771 1,550 8,221 399 — — — 399Citi-administered assetbackedcommercial paperconduits (ABCP) 29,302 18,821 10,481 — — 10,481 — 10,481Third-party commercialpaper conduits — — — — — — — —Collateralized debtobligations (CDOs) 3,086 — 3,086 74 — — — 74Collateralized loanobligations (CLOs) 10,115 — 10,115 497 — — — 497Asset-based financing 20,057 1,221 18,836 9,089 15 3,582 150 12,836Municipal securities tenderoption bond trusts (TOBs) 16,250 7,915 8,335 708 — 5,019 — 5,727Municipal investments 20,096 259 19,837 1,955 3,377 1,330 — 6,662Client intermediation 2,323 57 2,266 502 — — — 502Investment funds 3,321 24 3,297 — 160 48 — 208Trust preferred securities 17,958 — 17,958 — 128 — — 128Other 2,778 136 2,642 303 312 218 81 914Total $ 451,719 $ 107,565 $344,154 $ 17,283 $ 3,992 $ 20,678 $255 $ 42,208Citi HoldingsCredit card securitizations $ 648 $ 480 $ 168 $ — $ — $ — $ — $ —Mortgage securitizationsU.S. agency-sponsored 142,067 — 142,067 1,131 — — 148 1,279Non-agency-sponsored 19,780 1,751 18,029 66 — — 2 68Student loan securitizations 1,793 1,793 — — — — — —Collateralized debtobligations (CDOs) 5,777 — 5,777 159 — — 115 274Collateralized loanobligations (CLOs) 5,664 — 5,664 489 — 9 93 591Asset-based financing 7,182 32 7,150 3,748 3 237 — 3,988Municipal investments 5,849 — 5,849 185 260 65 — 510Client intermediation 83 83 — — — — — —Investment funds 1,161 14 1,147 — 44 — — 44Other 6,555 6,320 235 — 38 — — 38Total $ 196,559 $ 10,473 $186,086 $ 5,778 $ 345 $ 311 $ 358 $ 6,792Total <strong>Citigroup</strong> $ 648,278 $ 118,038 $530,240 $ 23,061 $ 4,337 $ 20,989 $ 613 $ 49,000(1) The definition of maximum exposure to loss is included in the text that follows this table.(2) Included in <strong>Citigroup</strong>‘s March 31, 2012 Consolidated Balance Sheet.(3) Not included in <strong>Citigroup</strong>‘s March 31, 2012 Consolidated Balance Sheet.(4) A significant unconsolidated VIE is an entity where the Company has any variable interest considered to be significant, regardless of the likelihood of loss or thenotional amount of exposure.(5) Citicorp mortgage securitizations also include agency and non-agency (private-label) re-securitization activities. These SPEs are not consolidated. See ―Re-Securitizations‖ below for further discussion.Reclassified to conform to the current year‘s presentation.135CITIGROUP – 2012 FIRST QUARTER 10-Q


