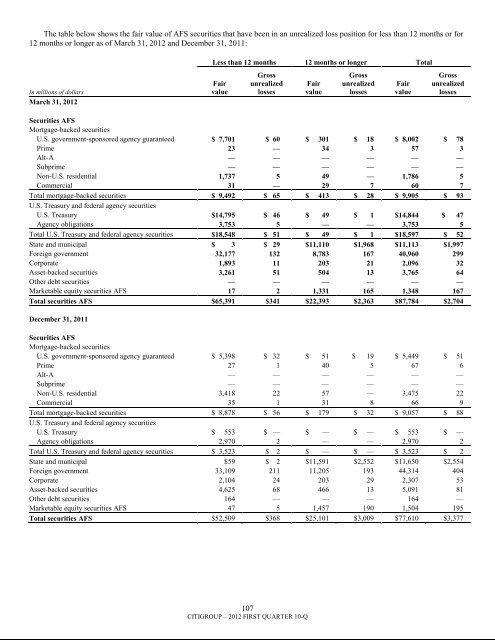
The table below shows the fair value of AFS securities that have been in an unrealized loss position for less than 12 months or for12 months or longer as of March 31, 2012 and December 31, 2011:Less than 12 months 12 months or longer TotalIn millions of dollarsMarch 31, 2012FairvalueGrossunrealizedlossesFairvalueGrossunrealizedlossesFairvalueGrossunrealizedlossesSecurities AFSMortgage-backed securitiesU.S. government-sponsored agency guaranteed $ 7,701 $ 60 $ 301 $ 18 $ 8,002 $ 78Prime 23 — 34 3 57 3Alt-A — — — — — —Subprime — — — — — —Non-U.S. residential 1,737 5 49 — 1,786 5Commercial 31 — 29 7 60 7Total mortgage-backed securities $ 9,492 $ 65 $ 413 $ 28 $ 9,905 $ 93U.S. Treasury and federal agency securitiesU.S. Treasury $14,795 $ 46 $ 49 $ 1 $14,844 $ 47Agency obligations 3,753 5 — — 3,753 5Total U.S. Treasury and federal agency securities $18,548 $ 51 $ 49 $ 1 $18,597 $ 52State and municipal $ 3 $ 29 $11,110 $1,968 $11,113 $1,997Foreign government 32,177 132 8,783 167 40,960 299Corporate 1,893 11 203 21 2,096 32Asset-backed securities 3,261 51 504 13 3,765 64Other debt securities — — — — — —Marketable equity securities AFS 17 2 1,331 165 1,348 167Total securities AFS $65,391 $341 $22,393 $2,363 $87,784 $2,704December 31, 2011Securities AFSMortgage-backed securitiesU.S. government-sponsored agency guaranteed $ 5,398 $ 32 $ 51 $ 19 $ 5,449 $ 51Prime 27 1 40 5 67 6Alt-A — — — — — —Subprime — — — — — —Non-U.S. residential 3,418 22 57 — 3,475 22Commercial 35 1 31 8 66 9Total mortgage-backed securities $ 8,878 $ 56 $ 179 $ 32 $ 9,057 $ 88U.S. Treasury and federal agency securitiesU.S. Treasury $ 553 $ — $ — $ — $ 553 $ —Agency obligations 2,970 2 — — 2,970 2Total U.S. Treasury and federal agency securities $ 3,523 $ 2 $ — $ — $ 3,523 $ 2State and municipal $59 $ 2 $11,591 $2,552 $11,650 $2,554Foreign government 33,109 211 11,205 193 44,314 404Corporate 2,104 24 203 29 2,307 53Asset-backed securities 4,625 68 466 13 5,091 81Other debt securities 164 — — — 164 —Marketable equity securities AFS 47 5 1,457 190 1,504 195Total securities AFS $52,509 $368 $25,101 $3,009 $77,610 $3,377107CITIGROUP – 2012 FIRST QUARTER 10-Q
The following table presents the amortized cost and fair value of AFS debt securities by contractual maturity dates as of March 31,2012 and December 31, 2011:Amortizedcost108CITIGROUP – 2012 FIRST QUARTER 10-QMarch 31, 2012 December 31, 2011AmortizedcostIn millions of dollarsFair valueFair valueMortgage-backed securities (1)Due within 1 year $ 16 $ 16 $ — $ —After 1 but within 5 years 429 431 422 423After 5 but within 10 years 2,031 2,104 2,757 2,834After 10 years (2) 48,459 49,583 46,470 47,768Total $ 50,935 $ 52,134 $ 49,649 $ 51,025U.S. Treasury and federal agency securitiesDue within 1 year $ 17,667 $ 17,687 $ 14,615 $ 14,637After 1 but within 5 years 65,596 66,914 62,241 63,823After 5 but within 10 years 4,201 4,515 5,862 6,239After 10 years (2) 59 58 382 439Total $ 87,523 $ 89,174 $ 83,100 $ 85,138State and municipalDue within 1 year $ 138 $ 139 $ 142 $ 142After 1 but within 5 years 498 500 455 457After 5 but within 10 years 194 204 182 188After 10 years (2) 15,188 13,301 16,040 13,612Total $ 16,018 $ 14,144 $ 16,819 $ 14,399Foreign governmentDue within 1 year $ 31,140 $ 31,112 $ 34,924 $ 34,864After 1 but within 5 years 49,469 49,215 41,612 41,675After 5 but within 10 years 7,121 7,554 6,993 6,998After 10 years (2) 1,251 1,396 831 977Total $ 88,981 $ 89,277 $ 84,360 $ 84,514All other (3)Due within 1 year $ 3,814 $ 3,827 $ 4,055 $ 4,072After 1 but within 5 years 10,863 10,980 9,843 9,928After 5 but within 10 years 3,873 4,026 3,009 3,160After 10 years (2) 4,604 4,597 4,821 4,783Total $ 23,154 $ 23,430 $ 21,728 $ 21,943Total debt securities AFS $266,611 $268,159 $255,656 $257,019(1) Includes mortgage-backed securities of U.S. government-sponsored entities.(2) Investments with no stated maturities are included as contractual maturities of greater than 10 years. Actual maturities may differ due to call or prepayment rights.(3) Includes corporate, asset-backed and other debt securities.The following table presents interest and dividends oninvestments for the three months ended March 31, 2012 and2011:Three months endedIn millions of dollarsMarch 31,2012March 31,2011Taxable interest $1,660 $2,121Interest exempt from U.S. federalincome tax 174 221Dividends 76 69Total interest and dividends $1,910 $2,411The following table presents realized gains and losses onall investments for the three months ended March 31, 2012and 2011. The gross realized investment losses exclude lossesfrom other-than-temporary impairment:Three months endedMarch 31, March 31,In millions of dollars2012 2011Gross realized investment gains $2,166 $ 680Gross realized investment losses (1) (241) (100)Net realized gains $1,925 $ 580(1) During the first quarter of 2012, the Company sold various debtsecurities that were classified as held-to-maturity. These sales were inresponse to a significant deterioration in the creditworthiness of theissuers or securities. The securities sold had a carrying value of $967million, and the Company recorded a realized loss of $144 million. Inaddition, a security with a carrying value of $39 million was reclassifiedto AFS securities in response to significant credit deterioration. TheCompany intends to sell the security and recorded an other-thantemporary-impairmentloss of $13 million, reflected in the followingtable.