

7.3 billion - Citigroup
7.3 billion - Citigroup
7.3 billion - Citigroup

Create successful ePaper yourself
Turn your PDF publications into a flip-book with our unique Google optimized e-Paper software.
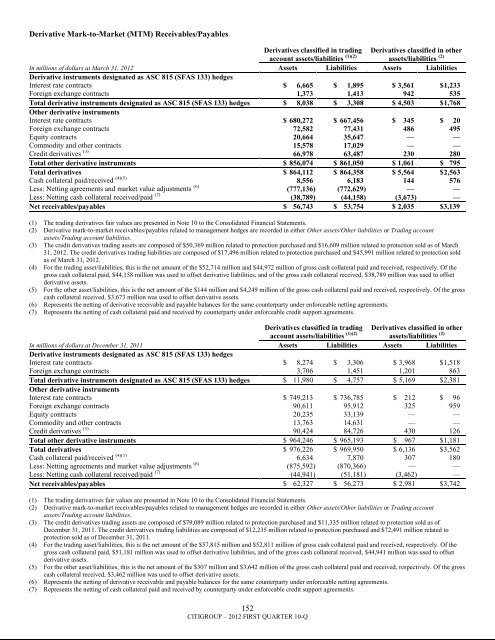
Derivative Mark-to-Market (MTM) Receivables/PayablesDerivatives classified in tradingaccount assets/liabilities (1)(2)Derivatives classified in otherassets/liabilities (2)In millions of dollars at March 31, 2012 Assets Liabilities Assets LiabilitiesDerivative instruments designated as ASC 815 (SFAS 133) hedgesInterest rate contracts $ 6,665 $ 1,895 $ 3,561 $ 1,233Foreign exchange contracts 1,373 1,413 942 535Total derivative instruments designated as ASC 815 (SFAS 133) hedges $ 8,038 $ 3,308 $ 4,503 $ 1,768Other derivative instrumentsInterest rate contracts $ 680,272 $ 667,456 $ 345 $ 20Foreign exchange contracts 72,582 77,431 486 495Equity contracts 20,664 35,647 — —Commodity and other contracts 15,578 17,029 — —Credit derivatives (3) 66,978 63,487 230 280Total other derivative instruments $ 856,074 $ 861,050 $ 1,061 $ 795Total derivatives $ 864,112 $ 864,358 $ 5,564 $ 2,563Cash collateral paid/received (4)(5) 8,556 6,183 144 576Less: Netting agreements and market value adjustments (6) (777,136) (772,629) — —Less: Netting cash collateral received/paid (7) (38,789) (44,158) (3,673) —Net receivables/payables $ 56,743 $ 53,754 $ 2,035 $3,139(1) The trading derivatives fair values are presented in Note 10 to the Consolidated Financial Statements.(2) Derivative mark-to-market receivables/payables related to management hedges are recorded in either Other assets/Other liabilities or Trading accountassets/Trading account liabilities.(3) The credit derivatives trading assets are composed of $50,369 million related to protection purchased and $16,609 million related to protection sold as of March31, 2012. The credit derivatives trading liabilities are composed of $17,496 million related to protection purchased and $45,991 million related to protection soldas of March 31, 2012.(4) For the trading asset/liabilities, this is the net amount of the $52,714 million and $44,972 million of gross cash collateral paid and received, respectively. Of thegross cash collateral paid, $44,158 million was used to offset derivative liabilities, and of the gross cash collateral received, $38,789 million was used to offsetderivative assets.(5) For the other asset/liabilities, this is the net amount of the $144 million and $4,249 million of the gross cash collateral paid and received, respectively. Of the grosscash collateral received, $3,673 million was used to offset derivative assets.(6) Represents the netting of derivative receivable and payable balances for the same counterparty under enforceable netting agreements.(7) Represents the netting of cash collateral paid and received by counterparty under enforceable credit support agreements.Derivatives classified in tradingaccount assets/liabilities (1)(2)Derivatives classified in otherassets/liabilities (2)In millions of dollars at December 31, 2011 Assets Liabilities Assets LiabilitiesDerivative instruments designated as ASC 815 (SFAS 133) hedgesInterest rate contracts $ 8,274 $ 3,306 $ 3,968 $ 1,518Foreign exchange contracts 3,706 1,451 1,201 863Total derivative instruments designated as ASC 815 (SFAS 133) hedges $ 11,980 $ 4,757 $ 5,169 $ 2,381Other derivative instrumentsInterest rate contracts $ 749,213 $ 736,785 $ 212 $ 96Foreign exchange contracts 90,611 95,912 325 959Equity contracts 20,235 33,139 — —Commodity and other contracts 13,763 14,631 — —Credit derivatives (3) 90,424 84,726 430 126Total other derivative instruments $ 964,246 $ 965,193 $ 967 $ 1,181Total derivatives $ 976,226 $ 969,950 $ 6,136 $ 3,562Cash collateral paid/received (4)(5) 6,634 7,870 307 180Less: Netting agreements and market value adjustments (6) (875,592) (870,366) — —Less: Netting cash collateral received/paid (7) (44,941) (51,181) (3,462) —Net receivables/payables $ 62,327 $ 56,273 $ 2,981 $ 3,742(1) The trading derivatives fair values are presented in Note 10 to the Consolidated Financial Statements.(2) Derivative mark-to-market receivables/payables related to management hedges are recorded in either Other assets/Other liabilities or Trading accountassets/Trading account liabilities.(3) The credit derivatives trading assets are composed of $79,089 million related to protection purchased and $11,335 million related to protection sold as ofDecember 31, 2011. The credit derivatives trading liabilities are composed of $12,235 million related to protection purchased and $72,491 million related toprotection sold as of December 31, 2011.(4) For the trading asset/liabilities, this is the net amount of the $57,815 million and $52,811 million of gross cash collateral paid and received, respectively. Of thegross cash collateral paid, $51,181 million was used to offset derivative liabilities, and of the gross cash collateral received, $44,941 million was used to offsetderivative assets.(5) For the other asset/liabilities, this is the net amount of the $307 million and $3,642 million of the gross cash collateral paid and received, respectively. Of the grosscash collateral received, $3,462 million was used to offset derivative assets.(6) Represents the netting of derivative receivable and payable balances for the same counterparty under enforceable netting agreements.(7) Represents the netting of cash collateral paid and received by counterparty under enforceable credit support agreements.152CITIGROUP – 2012 FIRST QUARTER 10-Q


