

7.3 billion - Citigroup
7.3 billion - Citigroup
7.3 billion - Citigroup

Create successful ePaper yourself
Turn your PDF publications into a flip-book with our unique Google optimized e-Paper software.
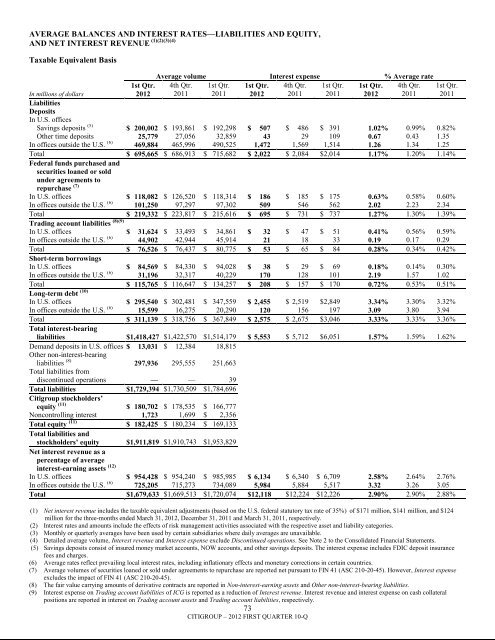
AVERAGE BALANCES AND INTEREST RATES—LIABILITIES AND EQUITY,AND NET INTEREST REVENUE (1)(2)(3)(4)Taxable Equivalent Basis1st Qtr.2012Average volume Interest expense % Average rate4th Qtr. 1st Qtr. 1st Qtr. 4th Qtr. 1st Qtr. 1st Qtr. 4th Qtr.2011 2011 2012 2011 2011 2012 20111st Qtr.2011In millions of dollarsLiabilitiesDepositsIn U.S. officesSavings deposits (5) $ 200,002 $ 193,861 $ 192,298 $ 507 $ 486 $ 391 1.02% 0.99% 0.82%Other time deposits 25,779 27,056 32,859 43 29 109 0.67 0.43 1.35In offices outside the U.S. (6) 469,884 465,996 490,525 1,472 1,569 1,514 1.26 1.34 1.25Total $ 695,665 $ 686,913 $ 715,682 $ 2,022 $ 2,084 $2,014 1.17% 1.20% 1.14%Federal funds purchased andsecurities loaned or soldunder agreements torepurchase (7)In U.S. offices $ 118,082 $ 126,520 $ 118,314 $ 186 $ 185 $ 175 0.63% 0.58% 0.60%In offices outside the U.S. (6) 101,250 97,297 97,302 509 546 562 2.02 2.23 2.34Total $ 219,332 $ 223,817 $ 215,616 $ 695 $ 731 $ 737 1.27% 1.30% 1.39%Trading account liabilities (8)(9)In U.S. offices $ 31,624 $ 33,493 $ 34,861 $ 32 $ 47 $ 51 0.41% 0.56% 0.59%In offices outside the U.S. (6) 44,902 42,944 45,914 21 18 33 0.19 0.17 0.29Total $ 76,526 $ 76,437 $ 80,775 $ 53 $ 65 $ 84 0.28% 0.34% 0.42%Short-term borrowingsIn U.S. offices $ 84,569 $ 84,330 $ 94,028 $ 38 $ 29 $ 69 0.18% 0.14% 0.30%In offices outside the U.S. (6) 31,196 32,317 40,229 170 128 101 2.19 1.57 1.02Total $ 115,765 $ 116,647 $ 134,257 $ 208 $ 157 $ 170 0.72% 0.53% 0.51%Long-term debt (10)In U.S. offices $ 295,540 $ 302,481 $ 347,559 $ 2,455 $ 2,519 $2,849 3.34% 3.30% 3.32%In offices outside the U.S. (6) 15,599 16,275 20,290 120 156 197 3.09 3.80 3.94Total $ 311,139 $ 318,756 $ 367,849 $ 2,575 $ 2,675 $3,046 3.33% 3.33% 3.36%Total interest-bearingliabilities $1,418,427 $1,422,570 $1,514,179 $ 5,553 $ 5,712 $6,051 1.57% 1.59% 1.62%Demand deposits in U.S. offices $ 13,031 $ 12,384 18,815Other non-interest-bearingliabilities (8) 297,936 295,555 251,663Total liabilities fromdiscontinued operations — — 39Total liabilities $1,729,394 $1,730,509 $1,784,696<strong>Citigroup</strong> stockholders’equity (11) $ 180,702 $ 178,535 $ 166,777Noncontrolling interest 1,723 1,699 $ 2,356Total equity (11) $ 182,425 $ 180,234 $ 169,133Total liabilities andstockholders’ equity $1,911,819 $1,910,743 $1,953,829Net interest revenue as apercentage of averageinterest-earning assets (12)In U.S. offices $ 954,428 $ 954,240 $ 985,985 $ 6,134 $ 6,340 $ 6,709 2.58% 2.64% 2.76%In offices outside the U.S. (6) 725,205 715,273 734,089 5,984 5,884 5,517 3.32 3.26 3.05Total $1,679,633 $1,669,513 $1,720,074 $12,118 $12,224 $12,226 2.90% 2.90% 2.88%(1) Net interest revenue includes the taxable equivalent adjustments (based on the U.S. federal statutory tax rate of 35%) of $171 million, $141 million, and $124million for the three-months ended March 31, 2012, December 31, 2011 and March 31, 2011, respectively.(2) Interest rates and amounts include the effects of risk management activities associated with the respective asset and liability categories.(3) Monthly or quarterly averages have been used by certain subsidiaries where daily averages are unavailable.(4) Detailed average volume, Interest revenue and Interest expense exclude Discontinued operations. See Note 2 to the Consolidated Financial Statements.(5) Savings deposits consist of insured money market accounts, NOW accounts, and other savings deposits. The interest expense includes FDIC deposit insurancefees and charges.(6) Average rates reflect prevailing local interest rates, including inflationary effects and monetary corrections in certain countries.(7) Average volumes of securities loaned or sold under agreements to repurchase are reported net pursuant to FIN 41 (ASC 210-20-45). However, Interest expenseexcludes the impact of FIN 41 (ASC 210-20-45).(8) The fair value carrying amounts of derivative contracts are reported in Non-interest-earning assets and Other non-interest-bearing liabilities.(9) Interest expense on Trading account liabilities of ICG is reported as a reduction of Interest revenue. Interest revenue and interest expense on cash collateralpositions are reported in interest on Trading account assets and Trading account liabilities, respectively.73CITIGROUP – 2012 FIRST QUARTER 10-Q


