

7.3 billion - Citigroup
7.3 billion - Citigroup
7.3 billion - Citigroup

You also want an ePaper? Increase the reach of your titles
YUMPU automatically turns print PDFs into web optimized ePapers that Google loves.
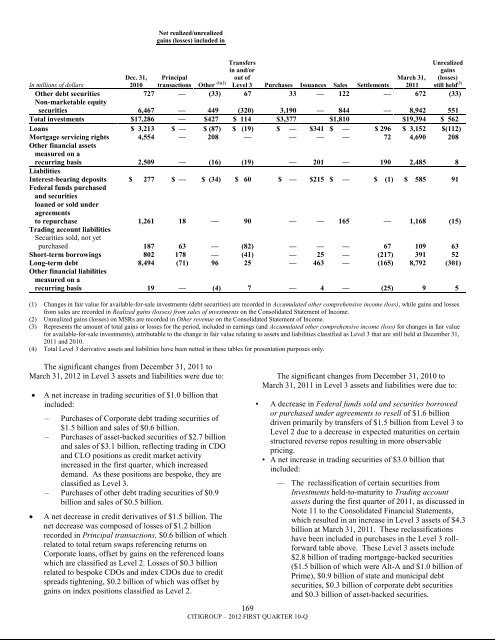
Net realized/unrealizedgains (losses) included inTransfersin and/orPrincipaltransactions Other (1)(2)out ofLevel 3 Purchases Issuances Sales Settlements169CITIGROUP – 2012 FIRST QUARTER 10-QUnrealizedgains(losses)still held (3)In millions of dollarsDec. 31,2010March 31,2011Other debt securities 727 — (33) 67 33 — 122 — 672 (33)Non-marketable equitysecurities 6,467 — 449 (320) 3,190 — 844 — 8,942 551Total investments $17,286 — $427 $ 114 $3,377 $1,810 $19,394 $ 562Loans $ 3,213 $ — $ (87) $ (19) $ — $341 $ — $ 296 $ 3,152 $(112)Mortgage servicing rights 4,554 — 208 — — — — 72 4,690 208Other financial assetsmeasured on arecurring basis 2,509 — (16) (19) — 201 — 190 2,485 8LiabilitiesInterest-bearing deposits $ 277 $ — $ (34) $ 60 $ — $215 $ — $ (1) $ 585 91Federal funds purchasedand securitiesloaned or sold underagreementsto repurchase 1,261 18 — 90 — — 165 — 1,168 (15)Trading account liabilitiesSecurities sold, not yetpurchased 187 63 — (82) — — — 67 109 63Short-term borrowings 802 178 — (41) — 25 — (217) 391 52Long-term debt 8,494 (71) 96 25 — 463 — (165) 8,792 (301)Other financial liabilitiesmeasured on arecurring basis 19 — (4) 7 — 4 — (25) 9 5(1) Changes in fair value for available-for-sale investments (debt securities) are recorded in Accumulated other comprehensive income (loss), while gains and lossesfrom sales are recorded in Realized gains (losses) from sales of investments on the Consolidated Statement of Income.(2) Unrealized gains (losses) on MSRs are recorded in Other revenue on the Consolidated Statement of Income.(3) Represents the amount of total gains or losses for the period, included in earnings (and Accumulated other comprehensive income (loss) for changes in fair valuefor available-for-sale investments), attributable to the change in fair value relating to assets and liabilities classified as Level 3 that are still held at December 31,2011 and 2010.(4) Total Level 3 derivative assets and liabilities have been netted in these tables for presentation purposes only.The significant changes from December 31, 2011 toMarch 31, 2012 in Level 3 assets and liabilities were due to:A net increase in trading securities of $1.0 <strong>billion</strong> thatincluded:– Purchases of Corporate debt trading securities of$1.5 <strong>billion</strong> and sales of $0.6 <strong>billion</strong>.– Purchases of asset-backed securities of $2.7 <strong>billion</strong>and sales of $3.1 <strong>billion</strong>, reflecting trading in CDOand CLO positions as credit market activityincreased in the first quarter, which increaseddemand. As these positions are bespoke, they areclassified as Level 3.– Purchases of other debt trading securities of $0.9<strong>billion</strong> and sales of $0.5 <strong>billion</strong>.A net decrease in credit derivatives of $1.5 <strong>billion</strong>. Thenet decrease was composed of losses of $1.2 <strong>billion</strong>recorded in Principal transactions, $0.6 <strong>billion</strong> of whichrelated to total return swaps referencing returns onCorporate loans, offset by gains on the referenced loanswhich are classified as Level 2. Losses of $0.3 <strong>billion</strong>related to bespoke CDOs and index CDOs due to creditspreads tightening, $0.2 <strong>billion</strong> of which was offset bygains on index positions classified as Level 2.The significant changes from December 31, 2010 toMarch 31, 2011 in Level 3 assets and liabilities were due to:• A decrease in Federal funds sold and securities borrowedor purchased under agreements to resell of $1.6 <strong>billion</strong>driven primarily by transfers of $1.5 <strong>billion</strong> from Level 3 toLevel 2 due to a decrease in expected maturities on certainstructured reverse repos resulting in more observablepricing.• A net increase in trading securities of $3.0 <strong>billion</strong> thatincluded:— The reclassification of certain securities fromInvestments held-to-maturity to Trading accountassets during the first quarter of 2011, as discussed inNote 11 to the Consolidated Financial Statements,which resulted in an increase in Level 3 assets of $4.3<strong>billion</strong> at March 31, 2011. These reclassificationshave been included in purchases in the Level 3 rollforwardtable above. These Level 3 assets include$2.8 <strong>billion</strong> of trading mortgage-backed securities($1.5 <strong>billion</strong> of which were Alt-A and $1.0 <strong>billion</strong> ofPrime), $0.9 <strong>billion</strong> of state and municipal debtsecurities, $0.3 <strong>billion</strong> of corporate debt securitiesand $0.3 <strong>billion</strong> of asset-backed securities.


