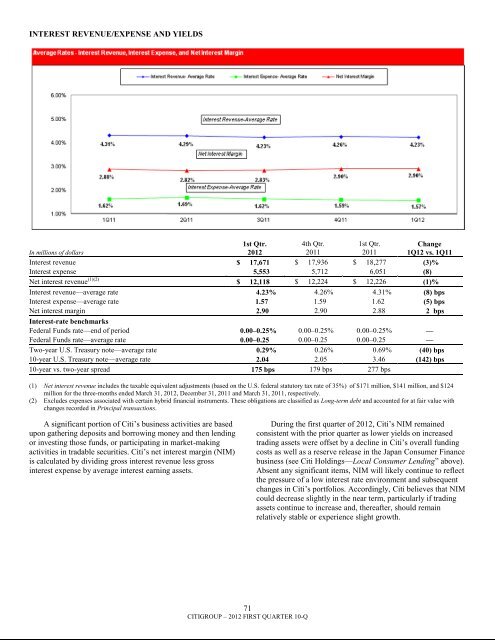
INTEREST REVENUE/EXPENSE AND YIELDSIn millions of dollars1st Qtr.20124th Qtr.20111st Qtr.2011Change1Q12 vs. 1Q11Interest revenue $ 17,671 $ 17,936 $ 18,277 (3)%Interest expense 5,553 5,712 6,051 (8)Net interest revenue (1)(2) $ 12,118 $ 12,224 $ 12,226 (1)%Interest revenue—average rate 4.23% 4.26% 4.31% (8) bpsInterest expense—average rate 1.57 1.59 1.62 (5) bpsNet interest margin 2.90 2.90 2.88 2 bpsInterest-rate benchmarksFederal Funds rate—end of period 0.00–0.25% 0.00–0.25% 0.00–0.25% —Federal Funds rate—average rate 0.00–0.25 0.00–0.25 0.00–0.25 —Two-year U.S. Treasury note—average rate 0.29% 0.26% 0.69% (40) bps10-year U.S. Treasury note—average rate 2.04 2.05 3.46 (142) bps10-year vs. two-year spread 175 bps 179 bps 277 bps(1) Net interest revenue includes the taxable equivalent adjustments (based on the U.S. federal statutory tax rate of 35%) of $171 million, $141 million, and $124million for the three-months ended March 31, 2012, December 31, 2011 and March 31, 2011, respectively.(2) Excludes expenses associated with certain hybrid financial instruments. These obligations are classified as Long-term debt and accounted for at fair value withchanges recorded in Principal transactions.A significant portion of Citi‘s business activities are basedupon gathering deposits and borrowing money and then lendingor investing those funds, or participating in market-makingactivities in tradable securities. Citi‘s net interest margin (NIM)is calculated by dividing gross interest revenue less grossinterest expense by average interest earning assets.During the first quarter of 2012, Citi‘s NIM remainedconsistent with the prior quarter as lower yields on increasedtrading assets were offset by a decline in Citi‘s overall fundingcosts as well as a reserve release in the Japan Consumer Financebusiness (see Citi Holdings—Local Consumer Lending‖ above).Absent any significant items, NIM will likely continue to reflectthe pressure of a low interest rate environment and subsequentchanges in Citi‘s portfolios. Accordingly, Citi believes that NIMcould decrease slightly in the near term, particularly if tradingassets continue to increase and, thereafter, should remainrelatively stable or experience slight growth.71CITIGROUP – 2012 FIRST QUARTER 10-Q
AVERAGE BALANCES AND INTEREST RATES—ASSETS (1)(2)(3)(4)Taxable Equivalent BasisIn millions of dollars1st Qtr.2012Average volume Interest revenue % Average rate4th Qtr. 1st Qtr. 1st Qtr. 4th Qtr. 1st Qtr. 1st Qtr. 4th Qtr.2011 2011 2012 2011 2011 2012 2011AssetsDeposits with banks (5) $ 160,751 $ 157,706 $ 179,510 $ 367 $ 408 $ 459 0.92% 1.03% 1.04%Federal funds sold andsecurities borrowed orpurchased underagreements to resell (6)In U.S. offices $ 153,655 $ 160,209 $ 151,041 $ 376 $ 373 $ 392 0.98% 0.92% 1.05%In offices outside the U.S. (5) 128,233 122,737 104,170 567 569 446 1.78 1.84 1.74Total $ 281,888 $ 282,946 $ 255,211 $ 943 $ 942 $ 838 1.35% 1.32% 1.33%(7) (8)Trading account assetsIn U.S. offices $ 118,932 $ 110,640 $ 132,016 $ 959 $ 1,017 $ 1,133 3.24% 3.65% 3.48%In offices outside the U.S. (5) 128,065 137,254 144,408 779 924 900 2.45 2.67 2.53Total $ 246,997 $ 247,894 $ 276,424 $ 1,738 $ 1,941 $ 2,033 2.83% 3.11% 2.98%InvestmentsIn U.S. officesTaxable $ 171,912 $ 165,311 $ 175,870 $ 762 $ 770 $ 950 1.78% 1.85% 2.19%Exempt from U.S. income tax 14,604 14,348 12,996 211 193 273 5.81 5.34 8.52In offices outside the U.S. (5) 113,241 109,040 131,540 1,027 987 1,285 3.65 3.59 3.96Total $ 299,757 $ 288,699 $ 320,406 $ 2,000 $ 1,950 $ 2,508 2.68% 2.68% 3.17%Loans (net of unearnedincome) (9)In U.S. offices $ 360,147 $ 365,155 $ 376,710 $ 6,905 $ 7,092 $ 7,445 7.71% 7.71% 8.02%In offices outside the U.S. (5) 286,864 279,924 262,320 5,580 5,463 4,843 7.82 7.74 7.49Total $ 647,011 $ 645,079 $ 639,030 $12,485 $12,555 $12,288 7.76% 7.72% 7.80%Other interest-earning assets $ 43,229 $ 47,189 $ 49,493 $ 138 $ 140 $ 151 1.28% 1.18% 1.24%Total interest-earning assets $1,679,633 $1,669,513 $1,720,074 $17,671 $17,936 $18,277 4.23% 4.26% 4.31%Non-interest-earning assets (7) 232,186 241,230 231,083Total assets from discontinuedoperations — — 2,672Total assets $1,911,819 $1,910,743 $1,953,829(1) Net interest revenue includes the taxable equivalent adjustments (based on the U.S. federal statutory tax rate of 35%) of $171 million, $141 million, and $124million for the three-months ended March 31, 2012, December 31, 2011 and March 31, 2011, respectively.(2) Interest rates and amounts include the effects of risk management activities associated with the respective asset and liability categories.(3) Monthly or quarterly averages have been used by certain subsidiaries where daily averages are unavailable.(4) Detailed average volume, Interest revenue and Interest expense exclude Discontinued operations. See Note 2 to the Consolidated Financial Statements.(5) Average rates reflect prevailing local interest rates, including inflationary effects and monetary corrections in certain countries.(6) Average volumes of securities borrowed or purchased under agreements to resell are reported net pursuant to FIN 41 (ASC 210-20-45). However, Interest revenueexcludes the impact of FIN 41 (ASC 210-20-45).(7) The fair value carrying amounts of derivative contracts are reported in Non-interest-earning assets and Other non-interest-bearing liabilities.(8) Interest expense on Trading account liabilities of ICG is reported as a reduction of Interest revenue. Interest revenue and interest expense on cash collateralpositions are reported in interest on Trading account assets and Trading account liabilities, respectively.(9) Includes cash-basis loans.1st Qtr.201172CITIGROUP – 2012 FIRST QUARTER 10-Q