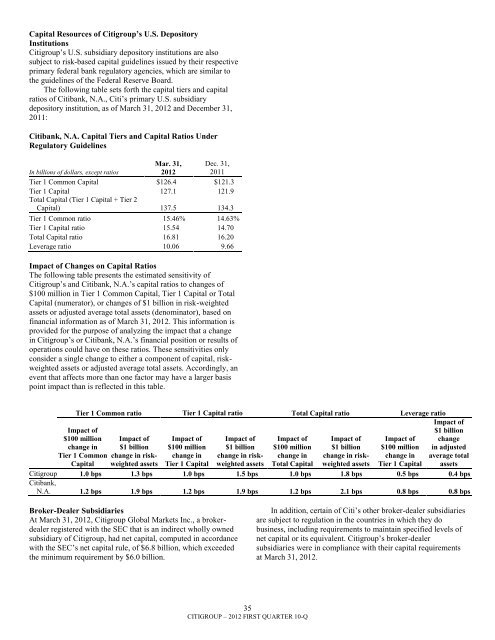
Capital Resources of <strong>Citigroup</strong>’s U.S. DepositoryInstitutions<strong>Citigroup</strong>‘s U.S. subsidiary depository institutions are alsosubject to risk-based capital guidelines issued by their respectiveprimary federal bank regulatory agencies, which are similar tothe guidelines of the Federal Reserve Board.The following table sets forth the capital tiers and capitalratios of Citibank, N.A., Citi‘s primary U.S. subsidiarydepository institution, as of March 31, 2012 and December 31,2011:Citibank, N.A. Capital Tiers and Capital Ratios UnderRegulatory GuidelinesIn <strong>billion</strong>s of dollars, except ratiosMar. 31,2012Dec. 31,2011Tier 1 Common Capital $126.4 $121.3Tier 1 Capital 127.1 121.9Total Capital (Tier 1 Capital + Tier 2Capital) 137.5 134.3Tier 1 Common ratio 15.46% 14.63%Tier 1 Capital ratio 15.54 14.70Total Capital ratio 16.81 16.20Leverage ratio 10.06 9.66Impact of Changes on Capital RatiosThe following table presents the estimated sensitivity of<strong>Citigroup</strong>‘s and Citibank, N.A.‘s capital ratios to changes of$100 million in Tier 1 Common Capital, Tier 1 Capital or TotalCapital (numerator), or changes of $1 <strong>billion</strong> in risk-weightedassets or adjusted average total assets (denominator), based onfinancial information as of March 31, 2012. This information isprovided for the purpose of analyzing the impact that a changein <strong>Citigroup</strong>‘s or Citibank, N.A.‘s financial position or results ofoperations could have on these ratios. These sensitivities onlyconsider a single change to either a component of capital, riskweightedassets or adjusted average total assets. Accordingly, anevent that affects more than one factor may have a larger basispoint impact than is reflected in this table.Tier 1 Common ratio Tier 1 Capital ratio Total Capital ratio Leverage ratioImpact of$100 million Impact ofchange in $1 <strong>billion</strong>Tier 1 Common change in risk-Capital weighted assetsImpact of$100 millionchange inTier 1 CapitalImpact of$1 <strong>billion</strong>change in riskweightedassetsImpact of$100 millionchange inTotal CapitalImpact of$1 <strong>billion</strong>change in riskweightedassetsImpact of$100 millionchange inTier 1 CapitalImpact of$1 <strong>billion</strong>changein adjustedaverage totalassets<strong>Citigroup</strong> 1.0 bps 1.3 bps 1.0 bps 1.5 bps 1.0 bps 1.8 bps 0.5 bps 0.4 bpsCitibank,N.A. 1.2 bps 1.9 bps 1.2 bps 1.9 bps 1.2 bps 2.1 bps 0.8 bps 0.8 bpsBroker-Dealer SubsidiariesAt March 31, 2012, <strong>Citigroup</strong> Global Markets Inc., a brokerdealerregistered with the SEC that is an indirect wholly ownedsubsidiary of <strong>Citigroup</strong>, had net capital, computed in accordancewith the SEC‘s net capital rule, of $6.8 <strong>billion</strong>, which exceededthe minimum requirement by $6.0 <strong>billion</strong>.In addition, certain of Citi‘s other broker-dealer subsidiariesare subject to regulation in the countries in which they dobusiness, including requirements to maintain specified levels ofnet capital or its equivalent. <strong>Citigroup</strong>‘s broker-dealersubsidiaries were in compliance with their capital requirementsat March 31, 2012.35CITIGROUP – 2012 FIRST QUARTER 10-Q
FUNDING AND LIQUIDITYOverviewCiti‘s funding and liquidity objectives generally are to maintainliquidity to fund its existing asset base as well as grow its corebusinesses in Citicorp, while at the same time maintainsufficient excess liquidity, structured appropriately, so that itcan operate under a wide variety of market conditions, includingmarket disruptions for both short- and long-term periods.<strong>Citigroup</strong>‘s primary liquidity objectives are established by entity,and in aggregate, across three major categories:(i) the non-bank, which is largely composed of the parentholding company (<strong>Citigroup</strong>) and Citi‘s broker-dealersubsidiaries (collectively referred to in this section as―non-bank‖);(ii) Citi‘s significant bank entities, such as Citibank, N.A.and its significant subsidiaries (collectively referred toin this section as ―significant Citibank entities‖); and(iii) other Citibank and Banamex entities.At an aggregate level, <strong>Citigroup</strong>‘s goal is to ensure thatthere is sufficient funding in amount and tenor to ensure thataggregate liquidity resources are available for these entities. Theliquidity framework requires that entities be self-sufficient ornet providers of liquidity, including in conditions establishedunder their designated stress tests, and have excess cash capital.Citi‘s primary sources of funding include (i) deposits viaCiti‘s bank subsidiaries, which continue to be Citi‘s lowest costsource of long-term funding, (ii) long-term debt (including longtermcollateralized financings) issued at the non-bank level andcertain bank subsidiaries, and (iii) stockholders‘ equity. Thesesources are supplemented by short-term borrowings, primarilyin the form of secured financing transactions (securities loanedor sold under agreements to repurchase, or repos), andcommercial paper at the non-bank level.As referenced above, <strong>Citigroup</strong> works to ensure that thestructural tenor of these funding sources is sufficiently long inrelation to the tenor of its asset base. The key goal of Citi‘sasset-liability management is to ensure that there is excess tenorin the liability structure so as to provide excess liquidity to fundthe assets. The excess liquidity resulting from a longer-termtenor profile can effectively offset potential decreases inliquidity that may occur under stress. This excess funding isheld in the form of aggregate liquidity resources, as describedbelow.Aggregate Liquidity ResourcesNon-bank (1)Significant CitibankEntitiesOther Citibank andBanamex EntitiesTotalIn <strong>billion</strong>s of dollarsMar. 31,2012Mar. 31,2011Mar. 31,2012Mar. 31,2011Mar. 31,2012Mar. 31,2011Mar. 31,2012Mar. 31,2011Cash at major central banks $ 24.9 $12.1 $ 99.6 $ 81.5 $ 9.4 $ 34.7 $133.9 $128.3Unencumbered liquid securities 67.6 83.4 135.8 167.6 83.3 67.8 286.7 318.8Total $92.5 $95.5 $235.4 $ 249.1 $92.7 $102.5 $420.5 $447.1(1) Non-bank includes the parent holding company (<strong>Citigroup</strong>), <strong>Citigroup</strong> Funding Inc. (CFI) and broker-dealer entities.As set forth in the table above, <strong>Citigroup</strong>‘s aggregateliquidity resources totaled $420.5 <strong>billion</strong> at March 31, 2012,compared with $447.1 at March 31, 2011. These amounts are asof period-end and may increase or decrease intra-period in theordinary course of business. During the quarter ended March 31,2012, the intra-quarter amounts did not fluctuate materially fromthe quarter-end amounts noted above.At March 31, 2012, <strong>Citigroup</strong>‘s non-bank aggregateliquidity resources totaled $92.5 <strong>billion</strong>, compared with $95.5<strong>billion</strong> at March 31, 2011. This amount included unencumberedliquid securities and cash held in Citi‘s U.S. and non-U.S.broker-dealer entities.<strong>Citigroup</strong>‘s significant Citibank entities had approximately$235.4 <strong>billion</strong> of aggregate liquidity resources as of March 31,2012. This amount included $99.6 <strong>billion</strong> of cash on depositwith major central banks (including the U.S. Federal ReserveBank, European Central Bank, Bank of England, Swiss NationalBank, Bank of Japan, the Monetary Authority of Singapore andthe Hong Kong Monetary Authority), compared with $81.5<strong>billion</strong> at March 31, 2011. The significant Citibank entities‘liquidity resources also included unencumbered highly liquidgovernment and government-backed securities. These securitiesare available-for-sale or secured financing through privatemarkets or by pledging to the major central banks. The liquidityvalue of these securities was $135.8 <strong>billion</strong> at March 31, 2012,compared with $167.6 <strong>billion</strong> at March 31, 2011. As shown inthe table above, overall, liquidity at Citi‘s significant Citibankentities was down year-over-year as Citi deployed some of itsexcess bank liquidity into loan growth within Citicorp (see―Balance Sheet Review‖ above) and paid down long-term bankdebt.Citi estimates that its other Citibank and Banamex entitiesand subsidiaries held approximately $92.7 <strong>billion</strong> in aggregateliquidity resources as of March 31, 2012. This included $9.4<strong>billion</strong> of cash on deposit with major central banks and $83.3<strong>billion</strong> of unencumbered liquid securities.Citi‘s table of aggregate liquidity resources above does notinclude additional potential liquidity in the form of <strong>Citigroup</strong>‘sborrowing capacity at the U.S. Federal Reserve Bank discountwindow, international central banks, and from the variousFederal Home Loan Banks (FHLB), which is maintained bypledged collateral to all such banks. Citi also maintainsadditional liquidity available in the form of diversified highgrade non-government securities.Moreover, in general, <strong>Citigroup</strong> can freely fund legalentities within its bank vehicles. In addition, <strong>Citigroup</strong>‘s banksubsidiaries, including Citibank, N.A., can lend to the <strong>Citigroup</strong>parent and broker-dealer entities in accordance with Section23A of the Federal Reserve Act. As of March 31, 2012, theamount available for lending to these non-bank entities under36CITIGROUP – 2012 FIRST QUARTER 10-Q