

7.3 billion - Citigroup
7.3 billion - Citigroup
7.3 billion - Citigroup

You also want an ePaper? Increase the reach of your titles
YUMPU automatically turns print PDFs into web optimized ePapers that Google loves.
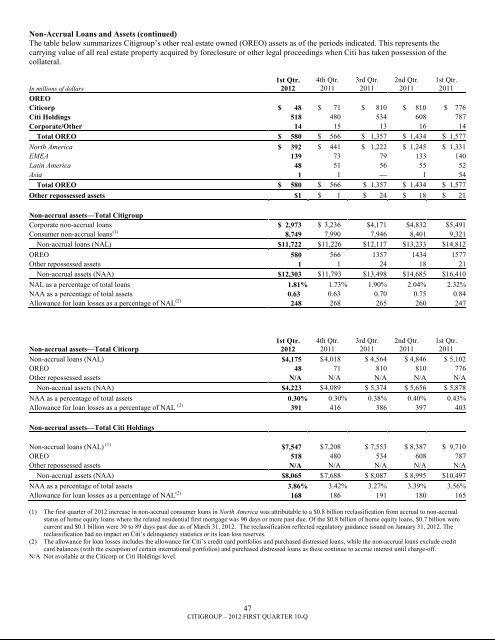
Non-Accrual Loans and Assets (continued)The table below summarizes <strong>Citigroup</strong>‘s other real estate owned (OREO) assets as of the periods indicated. This represents thecarrying value of all real estate property acquired by foreclosure or other legal proceedings when Citi has taken possession of thecollateral.In millions of dollars1st Qtr.20124th Qtr.20113rd Qtr.20112nd Qtr.2011OREOCiticorp $ 48 $ 71 $ 810 $ 810 $ 776Citi Holdings 518 480 534 608 787Corporate/Other 14 15 13 16 14Total OREO $ 580 $ 566 $ 1,357 $ 1,434 $ 1,577North America $ 392 $ 441 $ 1,222 $ 1,245 $ 1,331EMEA 139 73 79 133 140Latin America 48 51 56 55 52Asia 1 1 — 1 54Total OREO $ 580 $ 566 $ 1,357 $ 1,434 $ 1,577Other repossessed assets $1 $ 1 $ 24 $ 18 $ 21Non-accrual assets—Total <strong>Citigroup</strong>Corporate non-accrual loans $ 2,973 $ 3,236 $4,171 $4,832 $5,491Consumer non-accrual loans (1) 8,749 7,990 7,946 8,401 9,321Non-accrual loans (NAL) $11,722 $11,226 $12,117 $13,233 $14,812OREO 580 566 1357 1434 1577Other repossessed assets 1 1 24 18 21Non-accrual assets (NAA) $12,303 $11,793 $13,498 $14,685 $16,410NAL as a percentage of total loans 1.81% 1.73% 1.90% 2.04% 2.32%NAA as a percentage of total assets 0.63 0.63 0.70 0.75 0.84Allowance for loan losses as a percentage of NAL (2) 248 268 265 260 2471st Qtr.2011Non-accrual assets—Total Citicorp1st Qtr.20124th Qtr.20113rd Qtr.20112nd Qtr.20111st Qtr.2011Non-accrual loans (NAL) $4,175 $ 4,018 $ 4,564 $ 4,846 $ 5,102OREO 48 71 810 810 776Other repossessed assets N/A N/A N/A N/A N/ANon-accrual assets (NAA) $4,223 $ 4,089 $ 5,374 $ 5,656 $ 5,878NAA as a percentage of total assets 0.30% 0.30% 0.38% 0.40% 0.43%Allowance for loan losses as a percentage of NAL (2) 391 416 386 397 403Non-accrual assets—Total Citi HoldingsNon-accrual loans (NAL) (1) $7,547 $ 7,208 $ 7,553 $ 8,387 $ 9,710OREO 518 480 534 608 787Other repossessed assets N/A N/A N/A N/A N/ANon-accrual assets (NAA) $8,065 $ 7,688 $ 8,087 $ 8,995 $10,497NAA as a percentage of total assets 3.86% 3.42% 3.27% 3.39% 3.56%Allowance for loan losses as a percentage of NAL (2) 168 186 191 180 165(1) The first quarter of 2012 increase in non-accrual consumer loans in North America was attributable to a $0.8 <strong>billion</strong> reclassification from accrual to non-accrualstatus of home equity loans where the related residential first mortgage was 90 days or more past due. Of the $0.8 <strong>billion</strong> of home equity loans, $0.7 <strong>billion</strong> werecurrent and $0.1 <strong>billion</strong> were 30 to 89 days past due as of March 31, 2012. The reclassification reflected regulatory guidance issued on January 31, 2012. Thereclassification had no impact on Citi‘s delinquency statistics or its loan loss reserves.(2) The allowance for loan losses includes the allowance for Citi‘s credit card portfolios and purchased distressed loans, while the non-accrual loans exclude creditcard balances (with the exception of certain international portfolios) and purchased distressed loans as these continue to accrue interest until charge-off.N/A Not available at the Citicorp or Citi Holdings level.47CITIGROUP – 2012 FIRST QUARTER 10-Q


