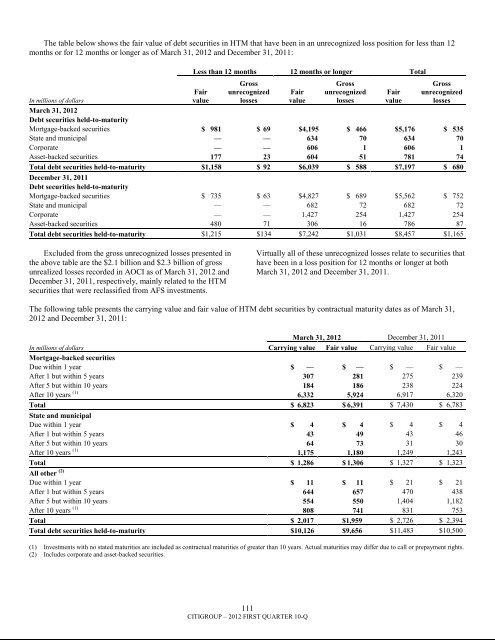
The table below shows the fair value of debt securities in HTM that have been in an unrecognized loss position for less than 12months or for 12 months or longer as of March 31, 2012 and December 31, 2011:Less than 12 months 12 months or longer TotalFairvalueGrossunrecognizedlossesFairvalueGrossunrecognizedlossesFairvalueGrossunrecognizedlossesIn millions of dollarsMarch 31, 2012Debt securities held-to-maturityMortgage-backed securities $ 981 $ 69 $4,195 $ 466 $5,176 $ 535State and municipal — — 634 70 634 70Corporate — — 606 1 606 1Asset-backed securities 177 23 604 51 781 74Total debt securities held-to-maturity $1,158 $ 92 $6,039 $ 588 $7,197 $ 680December 31, 2011Debt securities held-to-maturityMortgage-backed securities $ 735 $ 63 $4,827 $ 689 $5,562 $ 752State and municipal — — 682 72 682 72Corporate — — 1,427 254 1,427 254Asset-backed securities 480 71 306 16 786 87Total debt securities held-to-maturity $1,215 $134 $7,242 $1,031 $8,457 $1,165Excluded from the gross unrecognized losses presented inthe above table are the $2.1 <strong>billion</strong> and $2.3 <strong>billion</strong> of grossunrealized losses recorded in AOCI as of March 31, 2012 andDecember 31, 2011, respectively, mainly related to the HTMsecurities that were reclassified from AFS investments.Virtually all of these unrecognized losses relate to securities thathave been in a loss position for 12 months or longer at bothMarch 31, 2012 and December 31, 2011.The following table presents the carrying value and fair value of HTM debt securities by contractual maturity dates as of March 31,2012 and December 31, 2011:March 31, 2012 December 31, 2011In millions of dollars Carrying value Fair value Carrying value Fair valueMortgage-backed securitiesDue within 1 year $ — $ — $ — $ —After 1 but within 5 years 307 281 275 239After 5 but within 10 years 184 186 238 224After 10 years (1) 6,332 5,924 6,917 6,320Total $ 6,823 $ 6,391 $ 7,430 $ 6,783State and municipalDue within 1 year $ 4 $ 4 $ 4 $ 4After 1 but within 5 years 43 49 43 46After 5 but within 10 years 64 73 31 30After 10 years (1) 1,175 1,180 1,249 1,243Total $ 1,286 $ 1,306 $ 1,327 $ 1,323All other (2)Due within 1 year $ 11 $ 11 $ 21 $ 21After 1 but within 5 years 644 657 470 438After 5 but within 10 years 554 550 1,404 1,182After 10 years (1) 808 741 831 753Total $ 2,017 $1,959 $ 2,726 $ 2,394Total debt securities held-to-maturity $10,126 $9,656 $11,483 $10,500(1) Investments with no stated maturities are included as contractual maturities of greater than 10 years. Actual maturities may differ due to call or prepayment rights.(2) Includes corporate and asset-backed securities.111CITIGROUP – 2012 FIRST QUARTER 10-Q
Evaluating Investments for Other-Than-TemporaryImpairmentsThe Company conducts and documents periodic reviews of allsecurities with unrealized losses to evaluate whether theimpairment is other than temporary.Under the guidance for debt securities, other-thantemporaryimpairment (OTTI) is recognized in earnings for debtsecurities that the Company has an intent to sell or that theCompany believes it is more-likely-than-not that it will berequired to sell prior to recovery of the amortized cost basis. Forthose securities that the Company does not intend to sell orexpect to be required to sell, credit-related impairment isrecognized in earnings, with the non-credit-related impairmentrecorded in AOCI.An unrealized loss exists when the current fair value of anindividual security is less than its amortized cost basis.Unrealized losses that are determined to be temporary in natureare recorded, net of tax, in AOCI for AFS securities, while suchlosses related to HTM securities are not recorded, as theseinvestments are carried at their amortized cost. For securitiestransferred to HTM from Trading account assets, amortized costis defined as the fair value of the securities at the date of transfer,plus any accretion income and less any impairment recognizedin earnings subsequent to transfer. For securities transferred toHTM from AFS, amortized cost is defined as the originalpurchase cost, plus or minus any accretion or amortization of apurchase discount or premium, less any impairment recognizedin earnings.Regardless of the classification of the securities as AFS orHTM, the Company has assessed each position with anunrealized loss for OTTI. Factors considered in determiningwhether a loss is temporary include:the length of time and the extent to which fair value hasbeen below cost;the severity of the impairment;the cause of the impairment and the financial condition andnear-term prospects of the issuer;activity in the market of the issuer that may indicate adversecredit conditions; andthe Company‘s ability and intent to hold the investment fora period of time sufficient to allow for any anticipatedrecovery.The Company‘s review for impairment generally entails:identification and evaluation of investments that haveindications of possible impairment;analysis of individual investments that have fair values lessthan amortized cost, including consideration of the lengthof time the investment has been in an unrealized lossposition and the expected recovery period;discussion of evidential matter, including an evaluation offactors or triggers that could cause individual investmentsto qualify as having other-than-temporary impairment andthose that would not support other-than-temporaryimpairment; anddocumentation of the results of these analyses, as requiredunder business policies.112CITIGROUP – 2012 FIRST QUARTER 10-QFor equity securities, management considers the variousfactors described above, including its intent and ability to holdthe equity security for a period of time sufficient for recovery tocost or whether it is more-likely-than-not that the Company willbe required to sell the security prior to recovery of its cost basis.Where management lacks that intent or ability, the security‘sdecline in fair value is deemed to be other-than-temporary and isrecorded in earnings. AFS equity securities deemed other-thantemporarilyimpaired are written down to fair value, with thefull difference between fair value and cost recognized inearnings.Management assesses equity method investments with fairvalue less than carrying value for OTTI. Fair value is measuredas price multiplied by quantity if the investee has publicly listedsecurities. If the investee is not publicly listed, other methodsare used (see Note 19 to the Consolidated Financial Statements).For impaired equity method investments that Citi plans tosell prior to recovery of value, or would likely be required to selland there is no expectation that the fair value will recover priorto the expected sale date, the full impairment is recognized inthe Consolidated Statement of Income as OTTI regardless ofseverity and duration. The measurement of the OTTI does notinclude partial projected recoveries subsequent to the balancesheet date.For impaired equity method investments that managementdoes not plan to sell prior to recovery of value and is not likelyto be required to sell, the evaluation of whether an impairment isother than temporary is based on (i) whether and when an equitymethod investment will recover in value and (ii) whether theinvestor has the intent and ability to hold that investment for aperiod of time sufficient to recover the value. The determinationof whether the impairment is considered other than temporary isbased on all of the following indicators, regardless of the timeand extent of impairment:Cause of the impairment and the financial condition andnear-term prospects of the issuer, including any specificevents that may influence the operations of the issuer;Intent and ability to hold the investment for a period of timesufficient to allow for any anticipated recovery in marketvalue; andLength of time and extent to which fair value has been lessthan the carrying value.As previously announced on March 23, 2012, Citi plans toreduce its ownership interest in Akbank to below 10%, subjectto appropriate market conditions and required approvals. As ofMarch 31, 2012, Citi held a 20% equity interest in Akbank,which it purchased in January 2007, accounted for as an equitymethod investment. As a result of its decision to sell its shareholdings in Akbank, in the first quarter of 2012 Citi recorded animpairment charge related to its total investment in Akbankamounting to approximately $1.2 <strong>billion</strong> pretax ($763 millionafter-tax). This impairment charge was primarily driven by therecognition of all respective net investment foreign currencyhedging and translation losses previously reflected in AOCI aswell as a reduction in carrying value of the investment to reflectthe market price of Akbank‘s shares. The impairment chargewas recorded in Other-than-temporary impairment losses oninvestments in the Consolidated Statement of Income.As of March 31, 2012, Citi‘s carrying value of its equitymethod investment in the MSSB JV was approximately $10