

7.3 billion - Citigroup
7.3 billion - Citigroup
7.3 billion - Citigroup

You also want an ePaper? Increase the reach of your titles
YUMPU automatically turns print PDFs into web optimized ePapers that Google loves.
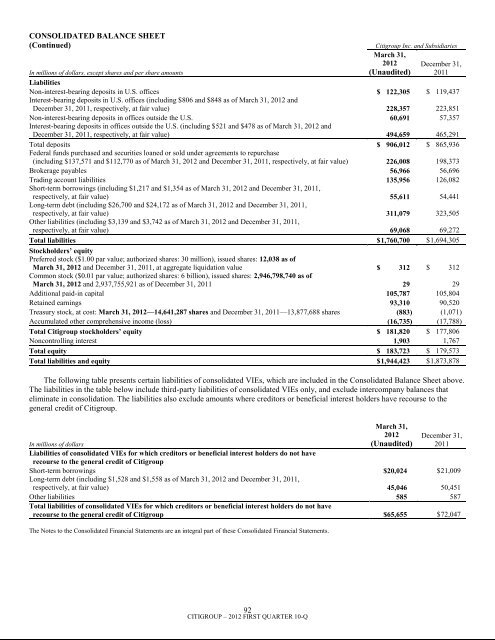
CONSOLIDATED BALANCE SHEET(Continued)In millions of dollars, except shares and per share amounts<strong>Citigroup</strong> Inc. and SubsidiariesMarch 31,2012 December 31,(Unaudited) 2011LiabilitiesNon-interest-bearing deposits in U.S. offices $ 122,305 $ 119,437Interest-bearing deposits in U.S. offices (including $806 and $848 as of March 31, 2012 andDecember 31, 2011, respectively, at fair value) 228,357 223,851Non-interest-bearing deposits in offices outside the U.S. 60,691 57,357Interest-bearing deposits in offices outside the U.S. (including $521 and $478 as of March 31, 2012 andDecember 31, 2011, respectively, at fair value) 494,659 465,291Total deposits $ 906,012 $ 865,936Federal funds purchased and securities loaned or sold under agreements to repurchase(including $137,571 and $112,770 as of March 31, 2012 and December 31, 2011, respectively, at fair value) 226,008 198,373Brokerage payables 56,966 56,696Trading account liabilities 135,956 126,082Short-term borrowings (including $1,217 and $1,354 as of March 31, 2012 and December 31, 2011,respectively, at fair value) 55,611 54,441Long-term debt (including $26,700 and $24,172 as of March 31, 2012 and December 31, 2011,respectively, at fair value) 311,079 323,505Other liabilities (including $3,139 and $3,742 as of March 31, 2012 and December 31, 2011,respectively, at fair value) 69,068 69,272Total liabilities $ 1,760,700 $ 1,694,305Stockholders’ equityPreferred stock ($1.00 par value; authorized shares: 30 million), issued shares: 12,038 as ofMarch 31, 2012 and December 31, 2011, at aggregate liquidation value $ 312 $ 312Common stock ($0.01 par value; authorized shares: 6 <strong>billion</strong>), issued shares: 2,946,798,740 as ofMarch 31, 2012 and 2,937,755,921 as of December 31, 2011 29 29Additional paid-in capital 105,787 105,804Retained earnings 93,310 90,520Treasury stock, at cost: March 31, 2012—14,641,287 shares and December 31, 2011—13,877,688 shares (883) (1,071)Accumulated other comprehensive income (loss) (16,735) (17,788)Total <strong>Citigroup</strong> stockholders’ equity $ 181,820 $ 177,806Noncontrolling interest 1,903 1,767Total equity $ 183,723 $ 179,573Total liabilities and equity $ 1,944,423 $ 1,873,878The following table presents certain liabilities of consolidated VIEs, which are included in the Consolidated Balance Sheet above.The liabilities in the table below include third-party liabilities of consolidated VIEs only, and exclude intercompany balances thateliminate in consolidation. The liabilities also exclude amounts where creditors or beneficial interest holders have recourse to thegeneral credit of <strong>Citigroup</strong>.March 31,2012(Unaudited)December 31,2011In millions of dollarsLiabilities of consolidated VIEs for which creditors or beneficial interest holders do not haverecourse to the general credit of <strong>Citigroup</strong>Short-term borrowings $20,024 $ 21,009Long-term debt (including $1,528 and $1,558 as of March 31, 2012 and December 31, 2011,respectively, at fair value) 45,046 50,451Other liabilities 585 587Total liabilities of consolidated VIEs for which creditors or beneficial interest holders do not haverecourse to the general credit of <strong>Citigroup</strong> $65,655 $ 72,047The Notes to the Consolidated Financial Statements are an integral part of these Consolidated Financial Statements.92CITIGROUP – 2012 FIRST QUARTER 10-Q


