

CONSULTING
20160713MSC-WNISR2016V2-LR
20160713MSC-WNISR2016V2-LR

Create successful ePaper yourself
Turn your PDF publications into a flip-book with our unique Google optimized e-Paper software.
Source Term<br />
There are various estimates of the amounts of radioactivity emitted to air, the so-called air source<br />
term, from Chernobyl and Fukushima.<br />
Table 11 provides estimates for the main nuclides released according to Fairlie 327 , Imanaka et al. 328<br />
and UNSCEAR 329 .<br />
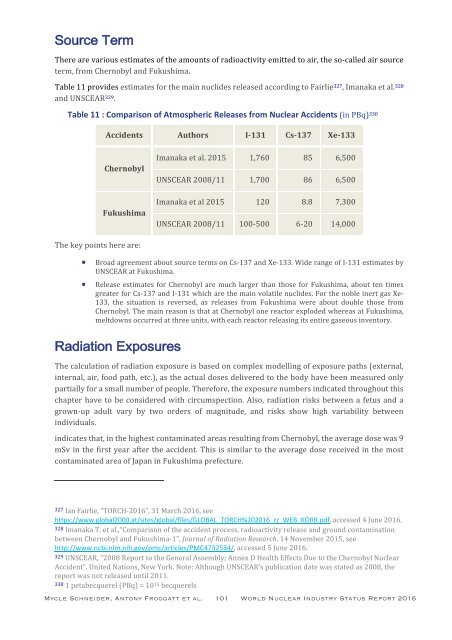
Table 11 : Comparison of Atmospheric Releases from Nuclear Accidents (in PBq) 330<br />
Accidents Authors I-131 Cs-137 Xe-133<br />
Chernobyl<br />
Imanaka et al. 2015 1,760 85 6,500<br />
UNSCEAR 2008/11 1,700 86 6,500<br />
Fukushima<br />
Imanaka et al 2015 120 8.8 7,300<br />
UNSCEAR 2008/11 100-500 6-20 14,000<br />
The key points here are:<br />
• Broad agreement about source terms on Cs-137 and Xe-133. Wide range of I-131 estimates by<br />
UNSCEAR at Fukushima.<br />
• Release estimates for Chernobyl are much larger than those for Fukushima, about ten times<br />
greater for Cs-137 and I-131 which are the main volatile nuclides. For the noble inert gas Xe-<br />
133, the situation is reversed, as releases from Fukushima were about double those from<br />
Chernobyl. The main reason is that at Chernobyl one reactor exploded whereas at Fukushima,<br />
meltdowns occurred at three units, with each reactor releasing its entire gaseous inventory.<br />
Radiation Exposures<br />
The calculation of radiation exposure is based on complex modelling of exposure paths (external,<br />
internal, air, food path, etc.), as the actual doses delivered to the body have been measured only<br />
partially for a small number of people. Therefore, the exposure numbers indicated throughout this<br />
chapter have to be considered with circumspection. Also, radiation risks between a fetus and a<br />
grown-up adult vary by two orders of magnitude, and risks show high variability between<br />
individuals.<br />
indicates that, in the highest contaminated areas resulting from Chernobyl, the average dose was 9<br />
mSv in the first year after the accident. This is similar to the average dose received in the most<br />
contaminated area of Japan in Fukushima prefecture.<br />
327 Ian Fairlie, “TORCH-2016”, 31 March 2016, see<br />
https://www.global2000.at/sites/global/files/GLOBAL_TORCH%202016_rz_WEB_KORR.pdf, accessed 4 June 2016.<br />
328 Imanaka T. et al.,“Comparison of the accident process, radioactivity release and ground contamination<br />
between Chernobyl and Fukushima-1”, Journal of Radiation Research, 14 November 2015, see<br />
http://www.ncbi.nlm.nih.gov/pmc/articles/PMC4732534/, accessed 5 June 2016.<br />
329 UNSCEAR, “2008 Report to the General Assembly; Annex D Health Effects Due to the Chernobyl Nuclear<br />
Accident”, United Nations, New York. Note: Although UNSCEAR’s publication date was stated as 2008, the<br />
report was not released until 2011.<br />
330 1 petabecquerel (PBq) = 10 15 becquerels<br />
Mycle Schneider, Antony Froggatt et al. 101 World Nuclear Industry Status Report 2016