

CONSULTING
20160713MSC-WNISR2016V2-LR
20160713MSC-WNISR2016V2-LR

Create successful ePaper yourself
Turn your PDF publications into a flip-book with our unique Google optimized e-Paper software.
The 13 th Five Year Plan is also proposing to increase the installed capacity of wind to 250 GW by<br />
2020. 348 Chinese officials envisage that there will be 58 GW of nuclear capacity in operation by<br />
2020, 349 up from 29.4 GW in mid-2016. However, the 21 units with 21.5 GW under construction<br />
will not be sufficient to reach the target. And the average construction time of the 25 units that<br />
China brought on line over the past decade was 5.7 years and many of the units under construction<br />
encounter significant delays. It appears therefore practically impossible for the country to reach<br />
its 2020 nuclear target.<br />
While the power sector in China continues to be dominated by coal, the growth rate of non-fossil<br />
fuels is still impressive. This increase in electricity production is delivering changes in the power<br />
mix. While China's the nuclear buildup is fast—production increase by a factor of over three in<br />
10 years, a factor of ten in 15 years—the renewable energy deployment has been breathtaking. In<br />
a decade Wind power increased generation from virtually nothing, that is less than 0.1 TWh in<br />
2006 to 185 TWh in 2015. Solar PV went from less than 1 TWh in 2010 to 39 TWh in 2015<br />
(see Figure 37).<br />
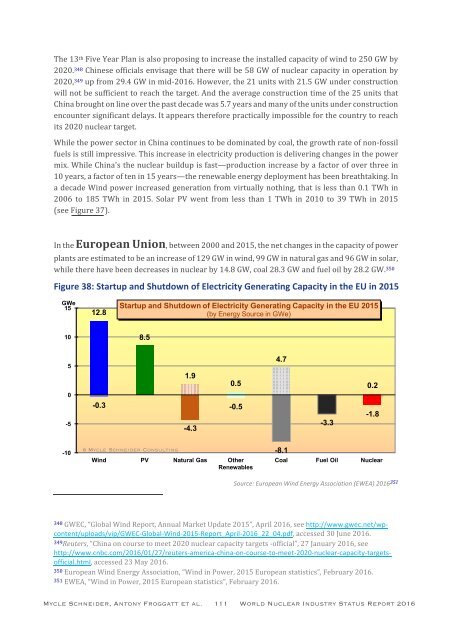
In the European Union, between 2000 and 2015, the net changes in the capacity of power<br />
plants are estimated to be an increase of 129 GW in wind, 99 GW in natural gas and 96 GW in solar,<br />
while there have been decreases in nuclear by 14.8 GW, coal 28.3 GW and fuel oil by 28.2 GW. 350<br />
Figure 38: Startup and Shutdown of Electricity Generating Capacity in the EU in 2015<br />
GWe<br />
15<br />
12.8<br />
Startup and Shutdown of Electricity Generating Capacity in the EU 2015<br />
(by Energy Source in GWe)<br />
10<br />
8.5<br />
5<br />
0<br />
-5<br />
-0.3<br />
1.9<br />
-4.3<br />
0.5<br />
-0.5<br />
4.7<br />
-3.3<br />
0.2<br />
-1.8<br />
-10<br />
© Mycle Schneider Consulting<br />
Wind PV Natural Gas Other<br />
Renewables<br />
-8.1<br />
Coal Fuel Oil Nuclear<br />
Source: European Wind Energy Association (EWEA) 2016 351<br />
348 GWEC, “Global Wind Report, Annual Market Update 2015”, April 2016, see http://www.gwec.net/wpcontent/uploads/vip/GWEC-Global-Wind-2015-Report_April-2016_22_04.pdf,<br />
accessed 30 June 2016.<br />
349Reuters, “China on course to meet 2020 nuclear capacity targets -official”, 27 January 2016, see<br />
http://www.cnbc.com/2016/01/27/reuters-america-china-on-course-to-meet-2020-nuclear-capacity-targetsofficial.html,<br />
accessed 23 May 2016.<br />
350 European Wind Energy Association, “Wind in Power, 2015 European statistics”, February 2016.<br />
351 EWEA, “Wind in Power, 2015 European statistics”, February 2016.<br />
Mycle Schneider, Antony Froggatt et al. 111 World Nuclear Industry Status Report 2016