

CONSULTING
20160713MSC-WNISR2016V2-LR
20160713MSC-WNISR2016V2-LR

You also want an ePaper? Increase the reach of your titles
YUMPU automatically turns print PDFs into web optimized ePapers that Google loves.
the past two decades, nuclear power lost a small part of its share in every single year, except for the<br />
years 1999 and 2001, and probably in year 2015 (+0.05 percentage points), should the figure be<br />
confirmed in the coming years. The main reason for this is the stagnation in the world's power<br />
consumption (+0.9 percent, slightly below the modest increase in nuclear generation of<br />
1.3 percent).<br />
In 2015, nuclear generation increased in 11 countries (down from 19 in 2014), declined in 15 (up<br />
from 9), and remained stable in five. 18 Five countries (China, Hungary, India, Russia, South Korea)<br />
achieved their greatest nuclear production in 2015, of these, China, Russia and South Korea<br />
connected new reactors to the grid. China started up a record eight units (see Figure 2). Only the<br />
two leading nuclear countries in the world, the U.S. and France have ever started up that many<br />
reactors in a single year, the U.S. in 1976, 1985 and 1987, and France in 1981. Besides China, two<br />
other countries increased their output by more than 20 percent in 2015—Argentina as it started<br />
up a third reactor in 2014, and Mexico that brought the second unit back on line after uprating. Two<br />
countries saw their nuclear generation drop by over 20 percent—Belgium that is struggling with<br />
reactor pressure vessel issues, and South Africa that has steam generator issues.<br />
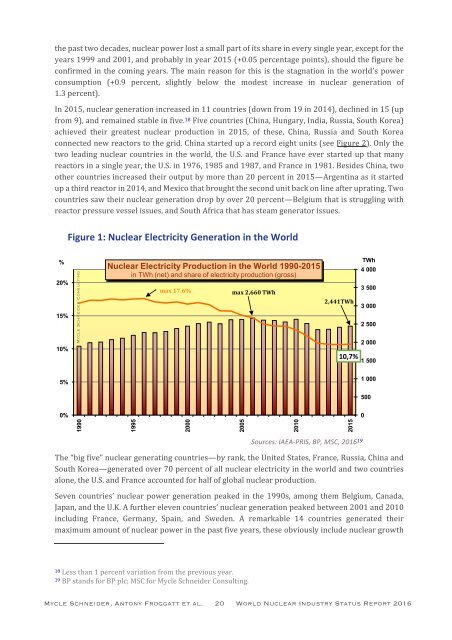
Figure 1: Nuclear Electricity Generation in the World<br />
%<br />
20%<br />
15%<br />
10%<br />
© Mycle Schneider Consulting<br />
Nuclear Electricity Production in the World 1990-2015<br />
in TWh (net) and share of electricity production (gross)<br />
max 17.6%<br />
max 2,660 TWh<br />
2,441TWh<br />
10,7%<br />
TWh<br />
4 000<br />
3 500<br />
3 000<br />
2 500<br />
2 000<br />
1 500<br />
5%<br />
1 000<br />
500<br />
0%<br />
0<br />
1990<br />
1995<br />
2000<br />
2005<br />
2010<br />
2015<br />
Sources: IAEA-PRIS, BP, MSC, 2016 19<br />
The “big five” nuclear generating countries—by rank, the United States, France, Russia, China and<br />
South Korea—generated over 70 percent of all nuclear electricity in the world and two countries<br />
alone, the U.S. and France accounted for half of global nuclear production.<br />
Seven countries’ nuclear power generation peaked in the 1990s, among them Belgium, Canada,<br />
Japan, and the U.K. A further eleven countries’ nuclear generation peaked between 2001 and 2010<br />
including France, Germany, Spain, and Sweden. A remarkable 14 countries generated their<br />
maximum amount of nuclear power in the past five years, these obviously include nuclear growth<br />
18 Less than 1 percent variation from the previous year.<br />
19 BP stands for BP plc; MSC for Mycle Schneider Consulting.<br />
Mycle Schneider, Antony Froggatt et al. 20 World Nuclear Industry Status Report 2016