

Dealing with salinity in Wheatbelt Valleys - Department of Water
Dealing with salinity in Wheatbelt Valleys - Department of Water
Dealing with salinity in Wheatbelt Valleys - Department of Water

You also want an ePaper? Increase the reach of your titles
YUMPU automatically turns print PDFs into web optimized ePapers that Google loves.
years) <strong>in</strong> order to collate a long-term comprehensive<br />
suite <strong>of</strong> data on dra<strong>in</strong>age performance. At this<br />
relatively early stage <strong>in</strong> the project only prelim<strong>in</strong>ary<br />
data and limited evaluation are available; however,<br />
<strong>Water</strong> Level (AHD)<br />
272.25<br />
272.00<br />
271.75<br />
271.50<br />
271.25<br />
27/03/00 27/05/00 27/07/00 27/09/00 27/11/00 27/01/01<br />
Time (date)<br />
(a) Town<br />
T1S<br />
T2S<br />
T3S<br />
T4S<br />
T1D<br />
T2D<br />
T3D<br />
T4D<br />
– 5 –<br />
Ali and Coles<br />
trends <strong>in</strong> shallow and deep piezometers at various<br />
transects and sites, quality <strong>of</strong> water flow<strong>in</strong>g <strong>in</strong> various<br />
dra<strong>in</strong>s, and water and salt outflow rate from the subcatchment<br />
will be discussed.<br />
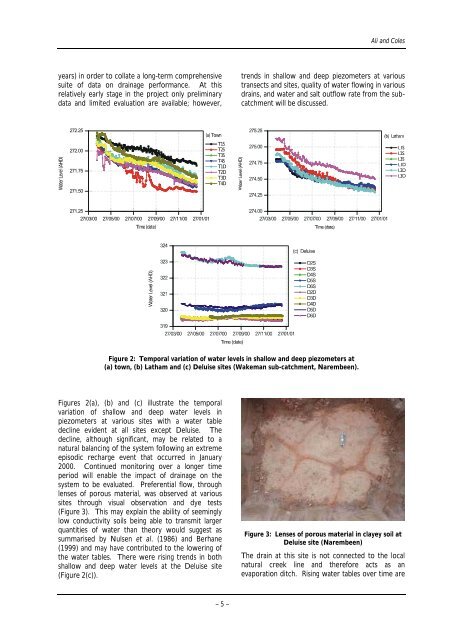
Figure 2: Temporal variation <strong>of</strong> water levels <strong>in</strong> shallow and deep piezometers at<br />
(a) town, (b) Latham and (c) Deluise sites (Wakeman sub-catchment, Narembeen).<br />
Figures 2(a), (b) and (c) illustrate the temporal<br />
variation <strong>of</strong> shallow and deep water levels <strong>in</strong><br />
piezometers at various sites <strong>with</strong> a water table<br />
decl<strong>in</strong>e evident at all sites except Deluise. The<br />
decl<strong>in</strong>e, although significant, may be related to a<br />
natural balanc<strong>in</strong>g <strong>of</strong> the system follow<strong>in</strong>g an extreme<br />
episodic recharge event that occurred <strong>in</strong> January<br />
2000. Cont<strong>in</strong>ued monitor<strong>in</strong>g over a longer time<br />
period will enable the impact <strong>of</strong> dra<strong>in</strong>age on the<br />
system to be evaluated. Preferential flow, through<br />
lenses <strong>of</strong> porous material, was observed at various<br />
sites through visual observation and dye tests<br />
(Figure 3). This may expla<strong>in</strong> the ability <strong>of</strong> seem<strong>in</strong>gly<br />
low conductivity soils be<strong>in</strong>g able to transmit larger<br />
quantities <strong>of</strong> water than theory would suggest as<br />
summarised by Nulsen et al. (1986) and Berhane<br />
(1999) and may have contributed to the lower<strong>in</strong>g <strong>of</strong><br />
the water tables. There were ris<strong>in</strong>g trends <strong>in</strong> both<br />
shallow and deep water levels at the Deluise site<br />
(Figure 2(c)).<br />
Figure 3: Lenses <strong>of</strong> porous material <strong>in</strong> clayey soil at<br />
Deluise site (Narembeen)<br />
The dra<strong>in</strong> at this site is not connected to the local<br />
natural creek l<strong>in</strong>e and therefore acts as an<br />
evaporation ditch. Ris<strong>in</strong>g water tables over time are


