

Dealing with salinity in Wheatbelt Valleys - Department of Water
Dealing with salinity in Wheatbelt Valleys - Department of Water
Dealing with salinity in Wheatbelt Valleys - Department of Water

You also want an ePaper? Increase the reach of your titles
YUMPU automatically turns print PDFs into web optimized ePapers that Google loves.
preventative impacts on <strong>sal<strong>in</strong>ity</strong> could be achieved<br />
by clever selection and placement <strong>of</strong> relatively<br />
small-scale treatments, or by changes to the<br />
management <strong>of</strong> traditional annual crops and<br />
pastures (<strong>in</strong> all but the most localised and smallscaled<br />
groundwater flow systems). The new<br />
consensus is that large proportions <strong>of</strong> land <strong>in</strong><br />
wheatbelt catchments would need to be<br />
revegetated <strong>with</strong> deep-rooted perennial plants<br />
(shrubs, perennial pastures or trees) for at least<br />
part <strong>of</strong> the time. The perennials would need to be<br />
<strong>in</strong>tegrated <strong>with</strong> eng<strong>in</strong>eer<strong>in</strong>g works, particularly<br />
shallow dra<strong>in</strong>age for surface water management.<br />
(Deep dra<strong>in</strong>s are discussed below under the<br />
head<strong>in</strong>g <strong>of</strong> “Repair<strong>in</strong>g Sal<strong>in</strong>ity”)<br />
Even <strong>with</strong> major revegetation and surface dra<strong>in</strong>age<br />
Sal<strong>in</strong>ity risk <strong>in</strong> 2100 (% <strong>of</strong> catchment)<br />
35<br />
30<br />
25<br />
20<br />
15<br />
10<br />
5<br />
0<br />
Limit <strong>with</strong> alley-farm<strong>in</strong>g/annuals Limit <strong>of</strong> tree belts &<br />
perennials <strong>in</strong> alleys<br />
Pannell<br />
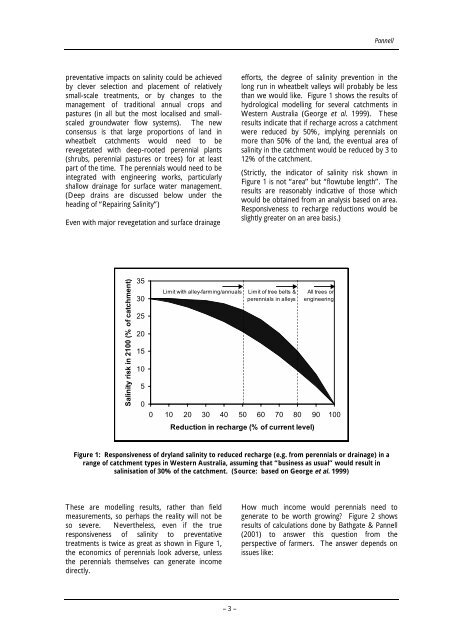
efforts, the degree <strong>of</strong> <strong>sal<strong>in</strong>ity</strong> prevention <strong>in</strong> the<br />
long run <strong>in</strong> wheatbelt valleys will probably be less<br />
than we would like. Figure 1 shows the results <strong>of</strong><br />
hydrological modell<strong>in</strong>g for several catchments <strong>in</strong><br />
Western Australia (George et al. 1999). These<br />
results <strong>in</strong>dicate that if recharge across a catchment<br />
were reduced by 50%, imply<strong>in</strong>g perennials on<br />
more than 50% <strong>of</strong> the land, the eventual area <strong>of</strong><br />
<strong>sal<strong>in</strong>ity</strong> <strong>in</strong> the catchment would be reduced by 3 to<br />
12% <strong>of</strong> the catchment.<br />
(Strictly, the <strong>in</strong>dicator <strong>of</strong> <strong>sal<strong>in</strong>ity</strong> risk shown <strong>in</strong><br />
Figure 1 is not “area” but “flowtube length”. The<br />
results are reasonably <strong>in</strong>dicative <strong>of</strong> those which<br />
would be obta<strong>in</strong>ed from an analysis based on area.<br />
Responsiveness to recharge reductions would be<br />
slightly greater on an area basis.)<br />
All trees or<br />
eng<strong>in</strong>eer<strong>in</strong>g<br />
0 10 20 30 40 50 60 70 80 90 100<br />
Reduction <strong>in</strong> recharge (% <strong>of</strong> current level)<br />
Figure 1: Responsiveness <strong>of</strong> dryland <strong>sal<strong>in</strong>ity</strong> to reduced recharge (e.g. from perennials or dra<strong>in</strong>age) <strong>in</strong> a<br />
range <strong>of</strong> catchment types <strong>in</strong> Western Australia, assum<strong>in</strong>g that “bus<strong>in</strong>ess as usual” would result <strong>in</strong><br />
sal<strong>in</strong>isation <strong>of</strong> 30% <strong>of</strong> the catchment. (Source: based on George et al. 1999)<br />
These are modell<strong>in</strong>g results, rather than field<br />
measurements, so perhaps the reality will not be<br />
so severe. Nevertheless, even if the true<br />
responsiveness <strong>of</strong> <strong>sal<strong>in</strong>ity</strong> to preventative<br />
treatments is twice as great as shown <strong>in</strong> Figure 1,<br />
the economics <strong>of</strong> perennials look adverse, unless<br />
the perennials themselves can generate <strong>in</strong>come<br />
directly.<br />
– 3 –<br />
How much <strong>in</strong>come would perennials need to<br />
generate to be worth grow<strong>in</strong>g? Figure 2 shows<br />
results <strong>of</strong> calculations done by Bathgate & Pannell<br />
(2001) to answer this question from the<br />
perspective <strong>of</strong> farmers. The answer depends on<br />
issues like:


