

Dealing with salinity in Wheatbelt Valleys - Department of Water
Dealing with salinity in Wheatbelt Valleys - Department of Water
Dealing with salinity in Wheatbelt Valleys - Department of Water

You also want an ePaper? Increase the reach of your titles
YUMPU automatically turns print PDFs into web optimized ePapers that Google loves.
Effect <strong>of</strong> clear<strong>in</strong>g on run<strong>of</strong>f<br />
The other key feature <strong>of</strong> the hydrology,<br />
nonstationarity, refers to the fact that the underly<strong>in</strong>g<br />
hydrological processes <strong>in</strong> these systems are still<br />
undergo<strong>in</strong>g pr<strong>of</strong>ound but subtle changes as a result <strong>of</strong><br />
historic clear<strong>in</strong>g. These changes <strong>in</strong>clude <strong>in</strong>creas<strong>in</strong>g<br />
run<strong>of</strong>f source areas due to ris<strong>in</strong>g regional<br />
groundwater, soil acidification, and decadal climate<br />
variability. In the longer-term, climate change may<br />
lead to decreased w<strong>in</strong>ter ra<strong>in</strong>fall, <strong>in</strong>creased summer<br />
Mean annual run<strong>of</strong>f (mm)<br />
25<br />
20<br />
15<br />
10<br />
5<br />
Hatton and Ruprecht<br />
ra<strong>in</strong>fall and possibly more extreme events. The<br />
hydrological systems today are neither the same as they<br />
were on settlement nor as they will be <strong>in</strong>to the future.<br />
Median annual streamflow for many <strong>of</strong> the smaller<br />
catchments <strong>in</strong> the <strong>Wheatbelt</strong> would have been close<br />
to zero prior to settlement. For the Avon catchment<br />
the annual average streamflow prior to clear<strong>in</strong>g was<br />
estimated to be 18% <strong>of</strong> the current water yield,<br />
approximately consistent <strong>with</strong> experimental results <strong>in</strong><br />
Ruprecht & Sch<strong>of</strong>ield (1991) (Figure 5).<br />
0<br />
0 20 40 60 80 100<br />
Clear<strong>in</strong>g (%)<br />
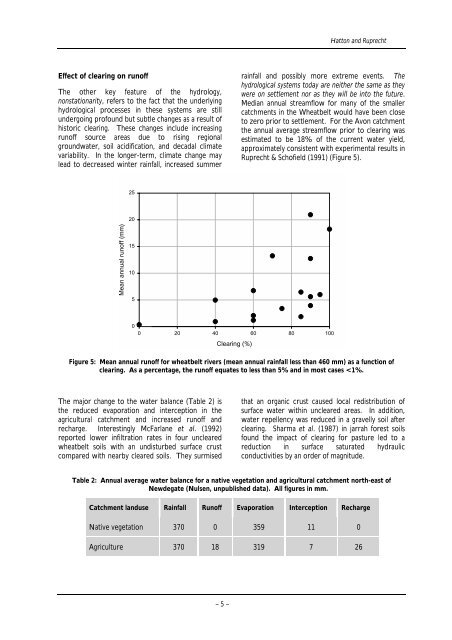
Figure 5: Mean annual run<strong>of</strong>f for wheatbelt rivers (mean annual ra<strong>in</strong>fall less than 460 mm) as a function <strong>of</strong><br />
clear<strong>in</strong>g. As a percentage, the run<strong>of</strong>f equates to less than 5% and <strong>in</strong> most cases


