

Dealing with salinity in Wheatbelt Valleys - Department of Water
Dealing with salinity in Wheatbelt Valleys - Department of Water
Dealing with salinity in Wheatbelt Valleys - Department of Water

You also want an ePaper? Increase the reach of your titles
YUMPU automatically turns print PDFs into web optimized ePapers that Google loves.
Lloyd<br />
0<br />
-500<br />
-1000<br />
-1500<br />
-2000<br />
-2500<br />
Jan-97<br />
Mar-97<br />
May-97<br />
Jul-97<br />
Sep-97<br />
Figure 1 shows the relationship between two<br />
bores <strong>in</strong> the same area. Prior to August 1997,<br />
both bores were surrounded by annual (sparse<br />
barley grass) pasture. There was a difference <strong>of</strong><br />
approximately 30 cm <strong>in</strong> the water levels between<br />
the two bores. Saltbush was seeded around bore<br />
8 <strong>in</strong> August 1997. With<strong>in</strong> twelve months the<br />
relationship had changed <strong>with</strong> the water <strong>in</strong> bore 8<br />
now lower than bore 9. This <strong>in</strong>creased <strong>with</strong> the<br />
onset <strong>of</strong> summer, until a difference <strong>of</strong> 70 cm<br />
between the two bores was observed – a total<br />
turnaround <strong>of</strong> 1 m. In August 1999, saltbush was<br />
Nov-97<br />
Jan-98<br />
Mar-98<br />
May-98<br />
Jul-98<br />
Sep-98<br />
"Bundilla" Bore 10<br />
Nov-98<br />
Jan-99<br />
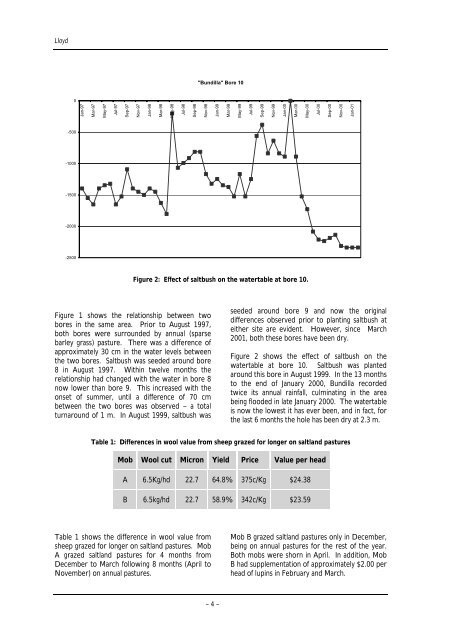
Figure 2: Effect <strong>of</strong> saltbush on the watertable at bore 10.<br />
Mar-99<br />
May-99<br />
Jul-99<br />
Sep-99<br />
Nov-99<br />
Jan-00<br />
Mar-00<br />
May-00<br />
seeded around bore 9 and now the orig<strong>in</strong>al<br />
differences observed prior to plant<strong>in</strong>g saltbush at<br />
either site are evident. However, s<strong>in</strong>ce March<br />
2001, both these bores have been dry.<br />
Figure 2 shows the effect <strong>of</strong> saltbush on the<br />
watertable at bore 10. Saltbush was planted<br />
around this bore <strong>in</strong> August 1999. In the 13 months<br />
to the end <strong>of</strong> January 2000, Bundilla recorded<br />
twice its annual ra<strong>in</strong>fall, culm<strong>in</strong>at<strong>in</strong>g <strong>in</strong> the area<br />
be<strong>in</strong>g flooded <strong>in</strong> late January 2000. The watertable<br />
is now the lowest it has ever been, and <strong>in</strong> fact, for<br />
the last 6 months the hole has been dry at 2.3 m.<br />
Table 1: Differences <strong>in</strong> wool value from sheep grazed for longer on saltland pastures<br />
Mob Wool cut Micron Yield Price Value per head<br />
A 6.5Kg/hd 22.7 64.8% 375c/Kg $24.38<br />
B 6.5kg/hd 22.7 58.9% 342c/Kg $23.59<br />
Table 1 shows the difference <strong>in</strong> wool value from<br />
sheep grazed for longer on saltland pastures. Mob<br />
A grazed saltland pastures for 4 months from<br />
December to March follow<strong>in</strong>g 8 months (April to<br />
November) on annual pastures.<br />
– 4 –<br />
Mob B grazed saltland pastures only <strong>in</strong> December,<br />
be<strong>in</strong>g on annual pastures for the rest <strong>of</strong> the year.<br />
Both mobs were shorn <strong>in</strong> April. In addition, Mob<br />
B had supplementation <strong>of</strong> approximately $2.00 per<br />
head <strong>of</strong> lup<strong>in</strong>s <strong>in</strong> February and March.<br />
Jul-00<br />
Sep-00<br />
Nov-00<br />
Jan-01


