

Dealing with salinity in Wheatbelt Valleys - Department of Water
Dealing with salinity in Wheatbelt Valleys - Department of Water
Dealing with salinity in Wheatbelt Valleys - Department of Water

You also want an ePaper? Increase the reach of your titles
YUMPU automatically turns print PDFs into web optimized ePapers that Google loves.
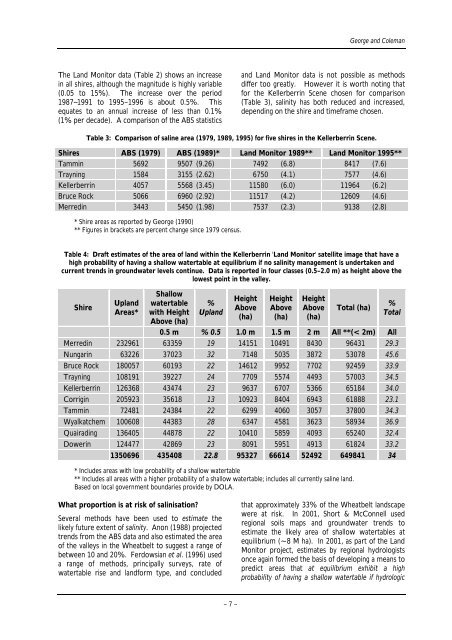
The Land Monitor data (Table 2) shows an <strong>in</strong>crease<br />
<strong>in</strong> all shires, although the magnitude is highly variable<br />
(0.05 to 15%). The <strong>in</strong>crease over the period<br />
1987--1991 to 1995–1996 is about 0.5%. This<br />
equates to an annual <strong>in</strong>crease <strong>of</strong> less than 0.1%<br />
(1% per decade). A comparison <strong>of</strong> the ABS statistics<br />
George and Coleman<br />
and Land Monitor data is not possible as methods<br />
differ too greatly. However it is worth not<strong>in</strong>g that<br />
for the Kellerberr<strong>in</strong> Scene chosen for comparison<br />
(Table 3), <strong>sal<strong>in</strong>ity</strong> has both reduced and <strong>in</strong>creased,<br />
depend<strong>in</strong>g on the shire and timeframe chosen.<br />
Table 3: Comparison <strong>of</strong> sal<strong>in</strong>e area (1979, 1989, 1995) for five shires <strong>in</strong> the Kellerberr<strong>in</strong> Scene.<br />
Shires ABS (1979) ABS (1989)* Land Monitor 1989** Land Monitor 1995**<br />
Tamm<strong>in</strong> 5692 9507 (9.26) 7492 (6.8) 8417 (7.6)<br />
Trayn<strong>in</strong>g 1584 3155 (2.62) 6750 (4.1) 7577 (4.6)<br />
Kellerberr<strong>in</strong> 4057 5568 (3.45) 11580 (6.0) 11964 (6.2)<br />
Bruce Rock 5066 6960 (2.92) 11517 (4.2) 12609 (4.6)<br />
Merred<strong>in</strong> 3443 5450 (1.98) 7537 (2.3) 9138 (2.8)<br />
* Shire areas as reported by George (1990)<br />
** Figures <strong>in</strong> brackets are percent change s<strong>in</strong>ce 1979 census.<br />
Table 4: Draft estimates <strong>of</strong> the area <strong>of</strong> land <strong>with</strong><strong>in</strong> the Kellerberr<strong>in</strong> 'Land Monitor' satellite image that have a<br />
high probability <strong>of</strong> hav<strong>in</strong>g a shallow watertable at equilibrium if no <strong>sal<strong>in</strong>ity</strong> management is undertaken and<br />
current trends <strong>in</strong> groundwater levels cont<strong>in</strong>ue. Data is reported <strong>in</strong> four classes (0.5–2.0 m) as height above the<br />
lowest po<strong>in</strong>t <strong>in</strong> the valley.<br />
Shire<br />
Upland<br />
Areas*<br />
Shallow<br />
watertable<br />
<strong>with</strong> Height<br />
Above (ha)<br />
%<br />
Upland<br />
Height<br />
Above<br />
(ha)<br />
Height<br />
Above<br />
(ha)<br />
Height<br />
Above<br />
(ha)<br />
Total (ha)<br />
%<br />
Total<br />
0.5 m % 0.5 1.0 m 1.5 m 2 m All **(< 2m) All<br />
Merred<strong>in</strong> 232961 63359 19 14151 10491 8430 96431 29.3<br />
Nungar<strong>in</strong> 63226 37023 32 7148 5035 3872 53078 45.6<br />
Bruce Rock 180057 60193 22 14612 9952 7702 92459 33.9<br />
Trayn<strong>in</strong>g 108191 39227 24 7709 5574 4493 57003 34.5<br />
Kellerberr<strong>in</strong> 126368 43474 23 9637 6707 5366 65184 34.0<br />
Corrig<strong>in</strong> 205923 35618 13 10923 8404 6943 61888 23.1<br />
Tamm<strong>in</strong> 72481 24384 22 6299 4060 3057 37800 34.3<br />
Wyalkatchem 100608 44383 28 6347 4581 3623 58934 36.9<br />
Quairad<strong>in</strong>g 136405 44878 22 10410 5859 4093 65240 32.4<br />
Dower<strong>in</strong> 124477 42869 23 8091 5951 4913 61824 33.2<br />
1350696 435408 22.8 95327 66614 52492 649841 34<br />
* Includes areas <strong>with</strong> low probability <strong>of</strong> a shallow watertable<br />
** Includes all areas <strong>with</strong> a higher probability <strong>of</strong> a shallow watertable; <strong>in</strong>cludes all currently sal<strong>in</strong>e land.<br />
Based on local government boundaries provide by DOLA.<br />
What proportion is at risk <strong>of</strong> sal<strong>in</strong>isation?<br />
Several methods have been used to estimate the<br />
likely future extent <strong>of</strong> <strong>sal<strong>in</strong>ity</strong>. Anon (1988) projected<br />
trends from the ABS data and also estimated the area<br />
<strong>of</strong> the valleys <strong>in</strong> the <strong>Wheatbelt</strong> to suggest a range <strong>of</strong><br />
between 10 and 20%. Ferdowsian et al. (1996) used<br />
a range <strong>of</strong> methods, pr<strong>in</strong>cipally surveys, rate <strong>of</strong><br />
watertable rise and landform type, and concluded<br />
– 7 –<br />
that approximately 33% <strong>of</strong> the <strong>Wheatbelt</strong> landscape<br />
were at risk. In 2001, Short & McConnell used<br />
regional soils maps and groundwater trends to<br />
estimate the likely area <strong>of</strong> shallow watertables at<br />
equilibrium (~8 M ha). In 2001, as part <strong>of</strong> the Land<br />
Monitor project, estimates by regional hydrologists<br />
once aga<strong>in</strong> formed the basis <strong>of</strong> develop<strong>in</strong>g a means to<br />
predict areas that at equilibrium exhibit a high<br />
probability <strong>of</strong> hav<strong>in</strong>g a shallow watertable if hydrologic


