

Dealing with salinity in Wheatbelt Valleys - Department of Water
Dealing with salinity in Wheatbelt Valleys - Department of Water
Dealing with salinity in Wheatbelt Valleys - Department of Water

You also want an ePaper? Increase the reach of your titles
YUMPU automatically turns print PDFs into web optimized ePapers that Google loves.
Porter, Bartle and Cooper<br />
Table 3: Distribution <strong>of</strong> farm debt among WA gra<strong>in</strong> farms as at 30 June 1999<br />
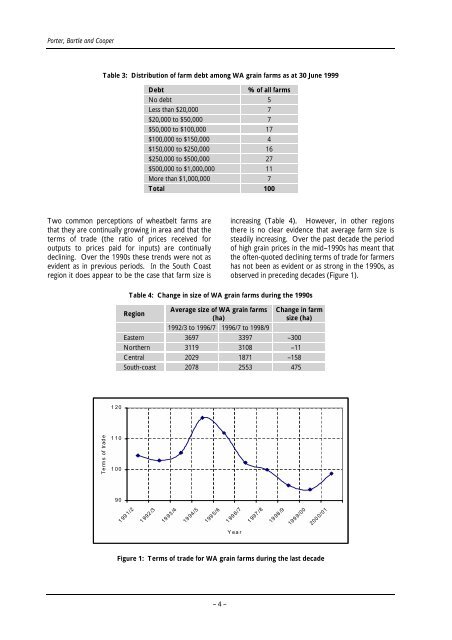
Two common perceptions <strong>of</strong> wheatbelt farms are<br />
that they are cont<strong>in</strong>ually grow<strong>in</strong>g <strong>in</strong> area and that the<br />
terms <strong>of</strong> trade (the ratio <strong>of</strong> prices received for<br />
outputs to prices paid for <strong>in</strong>puts) are cont<strong>in</strong>ually<br />
decl<strong>in</strong><strong>in</strong>g. Over the 1990s these trends were not as<br />
evident as <strong>in</strong> previous periods. In the South Coast<br />
region it does appear to be the case that farm size is<br />
Terms <strong>of</strong> trade<br />
120<br />
110<br />
100<br />
90<br />
Debt % <strong>of</strong> all farms<br />
No debt 5<br />
Less than $20,000 7<br />
$20,000 to $50,000 7<br />
$50,000 to $100,000 17<br />
$100,000 to $150,000 4<br />
$150,000 to $250,000 16<br />
$250,000 to $500,000 27<br />
$500,000 to $1,000,000 11<br />
More than $1,000,000 7<br />
Total 100<br />
<strong>in</strong>creas<strong>in</strong>g (Table 4). However, <strong>in</strong> other regions<br />
there is no clear evidence that average farm size is<br />
steadily <strong>in</strong>creas<strong>in</strong>g. Over the past decade the period<br />
<strong>of</strong> high gra<strong>in</strong> prices <strong>in</strong> the mid–1990s has meant that<br />
the <strong>of</strong>ten-quoted decl<strong>in</strong><strong>in</strong>g terms <strong>of</strong> trade for farmers<br />
has not been as evident or as strong <strong>in</strong> the 1990s, as<br />
observed <strong>in</strong> preced<strong>in</strong>g decades (Figure 1).<br />
Table 4: Change <strong>in</strong> size <strong>of</strong> WA gra<strong>in</strong> farms dur<strong>in</strong>g the 1990s<br />
Region<br />
Average size <strong>of</strong> WA gra<strong>in</strong> farms<br />
(ha)<br />
Change <strong>in</strong> farm<br />
size (ha)<br />
1992/3 to 1996/7 1996/7 to 1998/9<br />
Eastern 3697 3397 –300<br />
Northern 3119 3108 –11<br />
Central 2029 1871 –158<br />
South-coast 2078 2553 475<br />
1 991/2<br />
1 992/3<br />
1993/4<br />
1994/5<br />
1995/6<br />
1 996/7<br />
Year<br />
1 997/8<br />
1998/9<br />
1999/00<br />
2000/01<br />
Figure 1: Terms <strong>of</strong> trade for WA gra<strong>in</strong> farms dur<strong>in</strong>g the last decade<br />
– 4 –


