

Dealing with salinity in Wheatbelt Valleys - Department of Water
Dealing with salinity in Wheatbelt Valleys - Department of Water
Dealing with salinity in Wheatbelt Valleys - Department of Water

Create successful ePaper yourself
Turn your PDF publications into a flip-book with our unique Google optimized e-Paper software.
6320000<br />
6300000<br />
6280000<br />
6260000<br />
6240000<br />
600000<br />
600000<br />
(<br />
LEGEND<br />
NYABING<br />
620000<br />
Towns<br />
Roads<br />
Subcatchments<br />
Lakes<br />
Dra<strong>in</strong>age L<strong>in</strong>e<br />
Flowtube #1<br />
Flowtube #2<br />
Flowtube #3<br />
Flowtube #4<br />
620000<br />
640000<br />
(<br />
ONGERUP<br />
(<br />
640000<br />
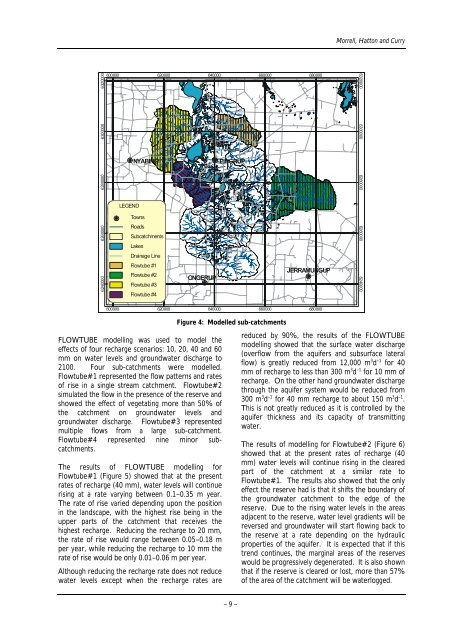
FLOWTUBE modell<strong>in</strong>g was used to model the<br />
effects <strong>of</strong> four recharge scenarios: 10, 20, 40 and 60<br />
mm on water levels and groundwater discharge to<br />
2100. Four sub-catchments were modelled.<br />
Flowtube#1 represented the flow patterns and rates<br />
<strong>of</strong> rise <strong>in</strong> a s<strong>in</strong>gle stream catchment. Flowtube#2<br />
simulated the flow <strong>in</strong> the presence <strong>of</strong> the reserve and<br />
showed the effect <strong>of</strong> vegetat<strong>in</strong>g more than 50% <strong>of</strong><br />
the catchment on groundwater levels and<br />
groundwater discharge. Flowtube#3 represented<br />
multiple flows from a large sub-catchment.<br />
Flowtube#4 represented n<strong>in</strong>e m<strong>in</strong>or subcatchments.<br />
The results <strong>of</strong> FLOWTUBE modell<strong>in</strong>g for<br />
Flowtube#1 (Figure 5) showed that at the present<br />
rates <strong>of</strong> recharge (40 mm), water levels will cont<strong>in</strong>ue<br />
ris<strong>in</strong>g at a rate vary<strong>in</strong>g between 0.1–0.35 m year.<br />
The rate <strong>of</strong> rise varied depend<strong>in</strong>g upon the position<br />
<strong>in</strong> the landscape, <strong>with</strong> the highest rise be<strong>in</strong>g <strong>in</strong> the<br />
upper parts <strong>of</strong> the catchment that receives the<br />
highest recharge. Reduc<strong>in</strong>g the recharge to 20 mm,<br />
the rate <strong>of</strong> rise would range between 0.05–0.18 m<br />
per year, while reduc<strong>in</strong>g the recharge to 10 mm the<br />
rate <strong>of</strong> rise would be only 0.01–0.06 m per year.<br />
Although reduc<strong>in</strong>g the recharge rate does not reduce<br />
water levels except when the recharge rates are<br />
PINGRUP<br />
660000<br />
660000<br />
Figure 4: Modelled sub-catchments<br />
– 9 –<br />
680000<br />
JERRAMUNGUP<br />
(<br />
680000<br />
Morrell, Hatton and Curry<br />
reduced by 90%, the results <strong>of</strong> the FLOWTUBE<br />
modell<strong>in</strong>g showed that the surface water discharge<br />
(overflow from the aquifers and subsurface lateral<br />
flow) is greatly reduced from 12,000 m 3 d –1 for 40<br />
mm <strong>of</strong> recharge to less than 300 m 3 d –1 for 10 mm <strong>of</strong><br />
recharge. On the other hand groundwater discharge<br />
through the aquifer system would be reduced from<br />
300 m 3 d –1 for 40 mm recharge to about 150 m 3 d –1 .<br />
This is not greatly reduced as it is controlled by the<br />
aquifer thickness and its capacity <strong>of</strong> transmitt<strong>in</strong>g<br />
water.<br />
The results <strong>of</strong> modell<strong>in</strong>g for Flowtube#2 (Figure 6)<br />
showed that at the present rates <strong>of</strong> recharge (40<br />
mm) water levels will cont<strong>in</strong>ue ris<strong>in</strong>g <strong>in</strong> the cleared<br />
part <strong>of</strong> the catchment at a similar rate to<br />
Flowtube#1. The results also showed that the only<br />
effect the reserve had is that it shifts the boundary <strong>of</strong><br />
the groundwater catchment to the edge <strong>of</strong> the<br />
reserve. Due to the ris<strong>in</strong>g water levels <strong>in</strong> the areas<br />
adjacent to the reserve, water level gradients will be<br />
reversed and groundwater will start flow<strong>in</strong>g back to<br />
the reserve at a rate depend<strong>in</strong>g on the hydraulic<br />
properties <strong>of</strong> the aquifer. It is expected that if this<br />
trend cont<strong>in</strong>ues, the marg<strong>in</strong>al areas <strong>of</strong> the reserves<br />
would be progressively degenerated. It is also shown<br />
that if the reserve is cleared or lost, more than 57%<br />
<strong>of</strong> the area <strong>of</strong> the catchment will be waterlogged.<br />
6320000<br />
6300000<br />
6280000<br />
6260000<br />
6240000


