

Dealing with salinity in Wheatbelt Valleys - Department of Water
Dealing with salinity in Wheatbelt Valleys - Department of Water
Dealing with salinity in Wheatbelt Valleys - Department of Water

Create successful ePaper yourself
Turn your PDF publications into a flip-book with our unique Google optimized e-Paper software.
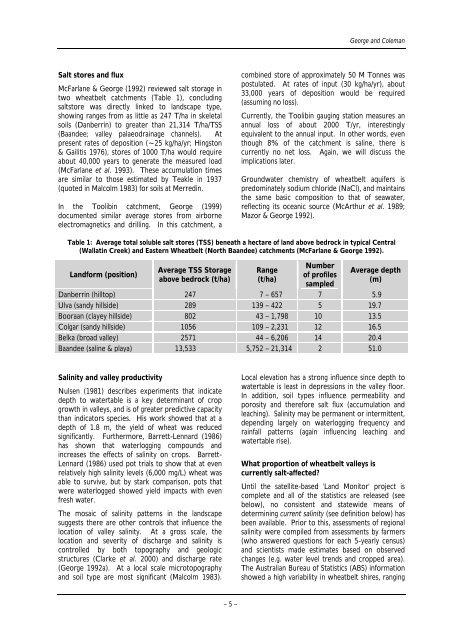
Salt stores and flux<br />
McFarlane & George (1992) reviewed salt storage <strong>in</strong><br />
two wheatbelt catchments (Table 1), conclud<strong>in</strong>g<br />
saltstore was directly l<strong>in</strong>ked to landscape type,<br />
show<strong>in</strong>g ranges from as little as 247 T/ha <strong>in</strong> skeletal<br />
soils (Danberr<strong>in</strong>) to greater than 21,314 T/ha/TSS<br />
(Baandee; valley palaeodra<strong>in</strong>age channels). At<br />
present rates <strong>of</strong> deposition (~25 kg/ha/yr; H<strong>in</strong>gston<br />
& Gailitis 1976), stores <strong>of</strong> 1000 T/ha would require<br />
about 40,000 years to generate the measured load<br />
(McFarlane et al. 1993). These accumulation times<br />
are similar to those estimated by Teakle <strong>in</strong> 1937<br />
(quoted <strong>in</strong> Malcolm 1983) for soils at Merred<strong>in</strong>.<br />
In the Toolib<strong>in</strong> catchment, George (1999)<br />
documented similar average stores from airborne<br />
electromagnetics and drill<strong>in</strong>g. In this catchment, a<br />
George and Coleman<br />
comb<strong>in</strong>ed store <strong>of</strong> approximately 50 M Tonnes was<br />
postulated. At rates <strong>of</strong> <strong>in</strong>put (30 kg/ha/yr), about<br />
33,000 years <strong>of</strong> deposition would be required<br />
(assum<strong>in</strong>g no loss).<br />
Currently, the Toolib<strong>in</strong> gaug<strong>in</strong>g station measures an<br />
annual loss <strong>of</strong> about 2000 T/yr, <strong>in</strong>terest<strong>in</strong>gly<br />
equivalent to the annual <strong>in</strong>put. In other words, even<br />
though 8% <strong>of</strong> the catchment is sal<strong>in</strong>e, there is<br />
currently no net loss. Aga<strong>in</strong>, we will discuss the<br />
implications later.<br />
Groundwater chemistry <strong>of</strong> wheatbelt aquifers is<br />
predom<strong>in</strong>ately sodium chloride (NaCl), and ma<strong>in</strong>ta<strong>in</strong>s<br />
the same basic composition to that <strong>of</strong> seawater,<br />
reflect<strong>in</strong>g its oceanic source (McArthur et al. 1989;<br />
Mazor & George 1992).<br />
Table 1: Average total soluble salt stores (TSS) beneath a hectare <strong>of</strong> land above bedrock <strong>in</strong> typical Central<br />
(Wallat<strong>in</strong> Creek) and Eastern <strong>Wheatbelt</strong> (North Baandee) catchments (McFarlane & George 1992).<br />
Landform (position)<br />
Average TSS Storage<br />
above bedrock (t/ha)<br />
Range<br />
(t/ha)<br />
Number<br />
<strong>of</strong> pr<strong>of</strong>iles<br />
sampled<br />
Average depth<br />
(m)<br />
Danberr<strong>in</strong> (hilltop) 247 7 – 657 7 5.9<br />
Ulva (sandy hillside) 289 139 – 422 5 19.7<br />
Booraan (clayey hillside) 802 43 – 1,798 10 13.5<br />
Colgar (sandy hillside) 1056 109 – 2,231 12 16.5<br />
Belka (broad valley) 2571 44 – 6,206 14 20.4<br />
Baandee (sal<strong>in</strong>e & playa) 13,533 5,752 – 21,314 2 51.0<br />
Sal<strong>in</strong>ity and valley productivity<br />
Nulsen (1981) describes experiments that <strong>in</strong>dicate<br />
depth to watertable is a key determ<strong>in</strong>ant <strong>of</strong> crop<br />
growth <strong>in</strong> valleys, and is <strong>of</strong> greater predictive capacity<br />
than <strong>in</strong>dicators species. His work showed that at a<br />
depth <strong>of</strong> 1.8 m, the yield <strong>of</strong> wheat was reduced<br />
significantly. Furthermore, Barrett-Lennard (1986)<br />
has shown that waterlogg<strong>in</strong>g compounds and<br />
<strong>in</strong>creases the effects <strong>of</strong> <strong>sal<strong>in</strong>ity</strong> on crops. Barrett-<br />
Lennard (1986) used pot trials to show that at even<br />
relatively high <strong>sal<strong>in</strong>ity</strong> levels (6,000 mg/L) wheat was<br />
able to survive, but by stark comparison, pots that<br />
were waterlogged showed yield impacts <strong>with</strong> even<br />
fresh water.<br />
The mosaic <strong>of</strong> <strong>sal<strong>in</strong>ity</strong> patterns <strong>in</strong> the landscape<br />
suggests there are other controls that <strong>in</strong>fluence the<br />
location <strong>of</strong> valley <strong>sal<strong>in</strong>ity</strong>. At a gross scale, the<br />
location and severity <strong>of</strong> discharge and <strong>sal<strong>in</strong>ity</strong> is<br />
controlled by both topography and geologic<br />
structures (Clarke et al. 2000) and discharge rate<br />
(George 1992a). At a local scale microtopography<br />
and soil type are most significant (Malcolm 1983).<br />
– 5 –<br />
Local elevation has a strong <strong>in</strong>fluence s<strong>in</strong>ce depth to<br />
watertable is least <strong>in</strong> depressions <strong>in</strong> the valley floor.<br />
In addition, soil types <strong>in</strong>fluence permeability and<br />
porosity and therefore salt flux (accumulation and<br />
leach<strong>in</strong>g). Sal<strong>in</strong>ity may be permanent or <strong>in</strong>termittent,<br />
depend<strong>in</strong>g largely on waterlogg<strong>in</strong>g frequency and<br />
ra<strong>in</strong>fall patterns (aga<strong>in</strong> <strong>in</strong>fluenc<strong>in</strong>g leach<strong>in</strong>g and<br />
watertable rise).<br />
What proportion <strong>of</strong> wheatbelt valleys is<br />
currently salt-affected?<br />
Until the satellite-based 'Land Monitor' project is<br />
complete and all <strong>of</strong> the statistics are released (see<br />
below), no consistent and statewide means <strong>of</strong><br />
determ<strong>in</strong><strong>in</strong>g current <strong>sal<strong>in</strong>ity</strong> (see def<strong>in</strong>ition below) has<br />
been available. Prior to this, assessments <strong>of</strong> regional<br />
<strong>sal<strong>in</strong>ity</strong> were compiled from assessments by farmers<br />
(who answered questions for each 5-yearly census)<br />
and scientists made estimates based on observed<br />
changes (e.g. water level trends and cropped area).<br />
The Australian Bureau <strong>of</strong> Statistics (ABS) <strong>in</strong>formation<br />
showed a high variability <strong>in</strong> wheatbelt shires, rang<strong>in</strong>g


