

Dealing with salinity in Wheatbelt Valleys - Department of Water
Dealing with salinity in Wheatbelt Valleys - Department of Water
Dealing with salinity in Wheatbelt Valleys - Department of Water

Create successful ePaper yourself
Turn your PDF publications into a flip-book with our unique Google optimized e-Paper software.
Frost and Burnside<br />
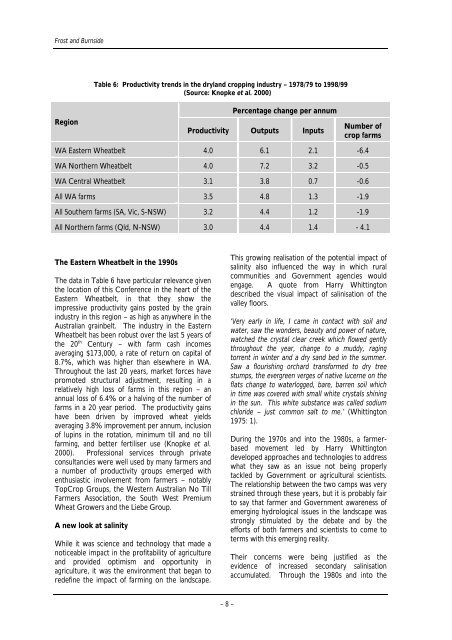
Region<br />
Table 6: Productivity trends <strong>in</strong> the dryland cropp<strong>in</strong>g <strong>in</strong>dustry – 1978/79 to 1998/99<br />
(Source: Knopke et al. 2000)<br />
Percentage change per annum<br />
Productivity Outputs Inputs<br />
Number <strong>of</strong><br />
crop farms<br />
WA Eastern <strong>Wheatbelt</strong> 4.0 6.1 2.1 -6.4<br />
WA Northern <strong>Wheatbelt</strong> 4.0 7.2 3.2 -0.5<br />
WA Central <strong>Wheatbelt</strong> 3.1 3.8 0.7 -0.6<br />
All WA farms 3.5 4.8 1.3 -1.9<br />
All Southern farms (SA, Vic, S-NSW) 3.2 4.4 1.2 -1.9<br />
All Northern farms (Qld, N-NSW) 3.0 4.4 1.4 - 4.1<br />
The Eastern <strong>Wheatbelt</strong> <strong>in</strong> the 1990s<br />
The data <strong>in</strong> Table 6 have particular relevance given<br />
the location <strong>of</strong> this Conference <strong>in</strong> the heart <strong>of</strong> the<br />
Eastern <strong>Wheatbelt</strong>, <strong>in</strong> that they show the<br />
impressive productivity ga<strong>in</strong>s posted by the gra<strong>in</strong><br />
<strong>in</strong>dustry <strong>in</strong> this region – as high as anywhere <strong>in</strong> the<br />
Australian gra<strong>in</strong>belt. The <strong>in</strong>dustry <strong>in</strong> the Eastern<br />
<strong>Wheatbelt</strong> has been robust over the last 5 years <strong>of</strong><br />
the 20 th Century – <strong>with</strong> farm cash <strong>in</strong>comes<br />
averag<strong>in</strong>g $173,000, a rate <strong>of</strong> return on capital <strong>of</strong><br />
8.7%, which was higher than elsewhere <strong>in</strong> WA.<br />
Throughout the last 20 years, market forces have<br />
promoted structural adjustment, result<strong>in</strong>g <strong>in</strong> a<br />
relatively high loss <strong>of</strong> farms <strong>in</strong> this region – an<br />
annual loss <strong>of</strong> 6.4% or a halv<strong>in</strong>g <strong>of</strong> the number <strong>of</strong><br />
farms <strong>in</strong> a 20 year period. The productivity ga<strong>in</strong>s<br />
have been driven by improved wheat yields<br />
averag<strong>in</strong>g 3.8% improvement per annum, <strong>in</strong>clusion<br />
<strong>of</strong> lup<strong>in</strong>s <strong>in</strong> the rotation, m<strong>in</strong>imum till and no till<br />
farm<strong>in</strong>g, and better fertiliser use (Knopke et al.<br />
2000). Pr<strong>of</strong>essional services through private<br />
consultancies were well used by many farmers and<br />
a number <strong>of</strong> productivity groups emerged <strong>with</strong><br />
enthusiastic <strong>in</strong>volvement from farmers – notably<br />
TopCrop Groups, the Western Australian No Till<br />
Farmers Association, the South West Premium<br />
Wheat Growers and the Liebe Group.<br />
A new look at <strong>sal<strong>in</strong>ity</strong><br />
While it was science and technology that made a<br />
noticeable impact <strong>in</strong> the pr<strong>of</strong>itability <strong>of</strong> agriculture<br />
and provided optimism and opportunity <strong>in</strong><br />
agriculture, it was the environment that began to<br />
redef<strong>in</strong>e the impact <strong>of</strong> farm<strong>in</strong>g on the landscape.<br />
– 8 –<br />
This grow<strong>in</strong>g realisation <strong>of</strong> the potential impact <strong>of</strong><br />
<strong>sal<strong>in</strong>ity</strong> also <strong>in</strong>fluenced the way <strong>in</strong> which rural<br />
communities and Government agencies would<br />
engage. A quote from Harry Whitt<strong>in</strong>gton<br />
described the visual impact <strong>of</strong> sal<strong>in</strong>isation <strong>of</strong> the<br />
valley floors.<br />
‘Very early <strong>in</strong> life, I came <strong>in</strong> contact <strong>with</strong> soil and<br />
water, saw the wonders, beauty and power <strong>of</strong> nature,<br />
watched the crystal clear creek which flowed gently<br />
throughout the year, change to a muddy, rag<strong>in</strong>g<br />
torrent <strong>in</strong> w<strong>in</strong>ter and a dry sand bed <strong>in</strong> the summer.<br />
Saw a flourish<strong>in</strong>g orchard transformed to dry tree<br />
stumps, the evergreen verges <strong>of</strong> native lucerne on the<br />
flats change to waterlogged, bare, barren soil which<br />
<strong>in</strong> time was covered <strong>with</strong> small white crystals sh<strong>in</strong><strong>in</strong>g<br />
<strong>in</strong> the sun. This white substance was called sodium<br />
chloride – just common salt to me.’ (Whitt<strong>in</strong>gton<br />
1975: 1).<br />
Dur<strong>in</strong>g the 1970s and <strong>in</strong>to the 1980s, a farmerbased<br />
movement led by Harry Whitt<strong>in</strong>gton<br />
developed approaches and technologies to address<br />
what they saw as an issue not be<strong>in</strong>g properly<br />
tackled by Government or agricultural scientists.<br />
The relationship between the two camps was very<br />
stra<strong>in</strong>ed through these years, but it is probably fair<br />
to say that farmer and Government awareness <strong>of</strong><br />
emerg<strong>in</strong>g hydrological issues <strong>in</strong> the landscape was<br />
strongly stimulated by the debate and by the<br />
efforts <strong>of</strong> both farmers and scientists to come to<br />
terms <strong>with</strong> this emerg<strong>in</strong>g reality.<br />
Their concerns were be<strong>in</strong>g justified as the<br />
evidence <strong>of</strong> <strong>in</strong>creased secondary sal<strong>in</strong>isation<br />
accumulated. Through the 1980s and <strong>in</strong>to the


