- Page 1 and 2:
Foreword Dealing with Salinity in W
- Page 3 and 4:
1Day one: Monday 30th July. Field t
- Page 5 and 6:
Papers Dealing with Salinity in Whe
- Page 7 and 8:
Ali and Coles biggest challenges fa
- Page 9 and 10:
Ali and Coles erosion, maintenance
- Page 11 and 12:
Ali and Coles expected under these
- Page 13 and 14:
Ali and Coles Coles, N.A. & Ali, M.
- Page 15 and 16:
Commander, Schoknecht, Verboom and
- Page 17 and 18:
Commander, Schoknecht, Verboom and
- Page 19 and 20:
Commander, Schoknecht, Verboom and
- Page 21 and 22:
Commander, Schoknecht, Verboom and
- Page 23 and 24:
Commander, Schoknecht, Verboom and
- Page 25 and 26:
Commander, Schoknecht, Verboom and
- Page 27 and 28:
Commander, Schoknecht, Verboom and
- Page 29 and 30:
Commander, Schoknecht, Verboom and
- Page 31 and 32:
Commander, Schoknecht, Verboom and
- Page 33 and 34:
Commander, Schoknecht, Verboom and
- Page 35 and 36:
Commander, Schoknecht, Verboom and
- Page 37 and 38:
Commander, Schoknecht, Verboom and
- Page 39 and 40:
Commander, Schoknecht, Verboom and
- Page 41 and 42:
APPRECIATING AND CREATING OUR HISTO
- Page 43 and 44:
services. The Government responded
- Page 45 and 46:
WHEATBELT VALLEYS IN DIFFICULTIES T
- Page 47 and 48:
argue that they were really abnorma
- Page 49 and 50:
1990s, the wheatbelt valleys in par
- Page 51 and 52:
REFERENCES Agstats (1997). Agricult
- Page 53 and 54:
George and Coleman two to four fold
- Page 55 and 56:
George and Coleman surface, the vas
- Page 57 and 58:
George and Coleman for example in t
- Page 59 and 60:
George and Coleman current trends c
- Page 61 and 62:
George and Coleman While not as div
- Page 63 and 64:
George and Coleman SPECIES Table 5:
- Page 65 and 66:
George and Coleman advantages of so
- Page 67 and 68:
George and Coleman this volume). In
- Page 69 and 70:
George and Coleman Venture Economy
- Page 71 and 72:
George and Coleman Lawrence, C. (19
- Page 73 and 74:
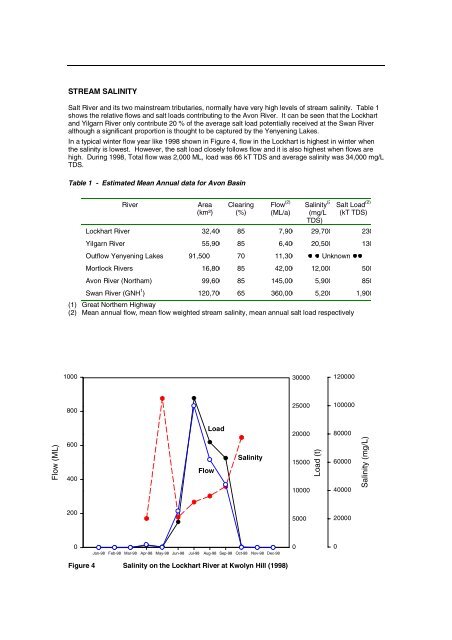
Hatton and Ruprecht WATCHING THE RI
- Page 75 and 76:
Since the mid 1970s annual rainfall
- Page 77 and 78:
Effect of clearing on runoff The ot
- Page 79 and 80:
Salinity Monthly streamflow (ML) 10
- Page 81 and 82:
The ratio of the salt outputs to in
- Page 83 and 84:
- 11 - Hatton and Ruprecht Table 4:
- Page 85 and 86:
THE FUTURE In looking at the future
- Page 87 and 88:
McFarlane, D.J., George, R.J. & Far
- Page 89 and 90:
Keighery, Halse and McKenzie Terres
- Page 91 and 92:
Keighery, Halse and McKenzie Wetlan
- Page 93 and 94:
Keighery, Halse and McKenzie specie
- Page 95 and 96:
Keighery, Halse and McKenzie enviro
- Page 97 and 98:
Lloyd number of legal cases pending
- Page 99 and 100:
Lloyd 0 -500 -1000 -1500 -2000 -250
- Page 101 and 102:
Lloyd Table 3. Sheep grazing days i
- Page 103 and 104:
Lloyd Hectares project to provide w
- Page 105 and 106:
INTRODUCTION The Lake Chinocup Catc
- Page 107 and 108:
agriculture) in various stages, the
- Page 109 and 110:
- 3,477 ha of remnant vegetation or
- Page 111 and 112:
Scientists talk of up to 30% of the
- Page 113 and 114:
6320000 6300000 6280000 6260000 624
- Page 115 and 116:
Although the waterlogged area under
- Page 117 and 118:
eliminates drainage through the nex
- Page 119 and 120:
REFERENCES Dawes, W.R., Stauffacher
- Page 121 and 122:
Pannell ECONOMICS, SOCIETY AND ENVI
- Page 123 and 124:
Pannell • the area of land protec
- Page 125 and 126:
Pannell Proposals to construct majo
- Page 127 and 128:
Pannell been conducted for the Cent
- Page 129 and 130:
Pannell investments in long-term la
- Page 131 and 132:
Pannell Pannell, D.J. (2001). Dryla
- Page 133 and 134:
Porter, Bartle and Cooper Table 1:
- Page 135 and 136:
Porter, Bartle and Cooper Table 3:
- Page 137 and 138:
Porter, Bartle and Cooper Table 5:
- Page 139 and 140:
Porter, Bartle and Cooper operation
- Page 141 and 142:
Porter, Bartle and Cooper Increase
- Page 143 and 144:
Porter, Bartle and Cooper Table 7:
- Page 145 and 146:
Porter, Bartle and Cooper support i
- Page 147 and 148:
Porter, Bartle and Cooper that is a
- Page 149 and 150:
CASE STUDY - TOOLIBIN LAKE AND CATC
- Page 151 and 152: • The distribution, storage and m
- Page 153 and 154: Secondly, there is a set of practic
- Page 155 and 156: within three categories: relationsh
- Page 157 and 158: CONCLUSIONS Actions to protect and
- Page 159 and 160: FIELD TOUR LOCATIONS FIELD TOUR NOT
- Page 161 and 162: COLES FARM “Avon River Basin Over
- Page 163 and 164: Conference Outcomes Dealing with Sa
- Page 165 and 166: with Salinity in Wheatbelt Valleys:
- Page 167 and 168: with Salinity in Wheatbelt Valleys
- Page 169 and 170: with Salinity in Wheatbelt Valleys
- Page 171 and 172: with Salinity in Wheatbelt Valleys
- Page 173 and 174: with Salinity in Wheatbelt Valleys
- Page 175 and 176: with Salinity in Wheatbelt Valleys
- Page 177 and 178: with Salinity in Wheatbelt Valleys
- Page 179 and 180: with Salinity in Wheatbelt Valleys
- Page 181 and 182: with Salinity in Wheatbelt Valleys
- Page 183 and 184: with Salinity in Wheatbelt Valleys
- Page 185 and 186: with Salinity in Wheatbelt Valleys
- Page 187 and 188: with Salinity in Wheatbelt Valleys
- Page 189 and 190: with Salinity in Wheatbelt Valleys
- Page 191 and 192: with Salinity in Wheatbelt Valleys
- Page 193 and 194: with Salinity in Wheatbelt Valleys
- Page 195 and 196: with Salinity in Wheatbelt Valleys
- Page 197 and 198: Photo Gallery 2 Dealing with Salini
- Page 199 and 200: APPENDIX 1 BACKGROUND HYDROLOGY AND
- Page 201: WHEATBELT HYDROLOGY Flow in the Yil
- Page 205 and 206: APPENDIX 2 WATER MANAGEMENT OPTIONS
- Page 207 and 208: APPENDIX 3 MANAGING WATER AND SALIN
- Page 209 and 210: SUMMARY- TIMELINE OF RECENT SIGNIFI
- Page 211 and 212: RECENT HISTORY OF WATER AND SALINIT
- Page 213 and 214: Figure 1. Hydrological cross-sectio
- Page 215: Depth (m) 316 315 314 313 312 311 M
- Page 218 and 219: FURTHER INVESTIGATIONS AND MANAGEME
- Page 220 and 221: FURTHER INVESTIGATIONS AND MANAGEME
- Page 222 and 223: FURTHER INVESTIGATIONS AND MANAGEME


