

Dealing with salinity in Wheatbelt Valleys - Department of Water
Dealing with salinity in Wheatbelt Valleys - Department of Water
Dealing with salinity in Wheatbelt Valleys - Department of Water

Create successful ePaper yourself
Turn your PDF publications into a flip-book with our unique Google optimized e-Paper software.
George and Coleman<br />
for example <strong>in</strong> the Central and Eastern <strong>Wheatbelt</strong><br />
from Tamm<strong>in</strong> (9.26%) to Merred<strong>in</strong> (2.3%) (George<br />
1990). These were considered to be an underestimate<br />
<strong>of</strong> the real extent <strong>of</strong> salt-affected land.<br />
In 1988, regional hydrologists <strong>of</strong> the WA <strong>Department</strong><br />
<strong>of</strong> Agriculture estimated areas <strong>of</strong> <strong>sal<strong>in</strong>ity</strong> and trends<br />
across the state. Anon (1988) describes that <strong>in</strong> the<br />
Eastern <strong>Wheatbelt</strong>, where at that time no substantive<br />
evidence <strong>of</strong> groundwater rise existed (bores drilled<br />
<strong>in</strong> 1985 onwards had too short a record), <strong>sal<strong>in</strong>ity</strong><br />
affected only 1.64% (based on ABS 1984 data) <strong>of</strong> the<br />
area and that potentially 10–20% was at risk. In<br />
1994, <strong>with</strong> better catchment mapp<strong>in</strong>g and longer<br />
groundwater records, Ferdowsian et al. (1996)<br />
<strong>in</strong>dicated as much as 9% <strong>of</strong> farmland was 'affected'<br />
by <strong>sal<strong>in</strong>ity</strong> to some degree (greater than 50% yield<br />
reduction). They concluded that <strong>sal<strong>in</strong>ity</strong> could<br />
potentially double and then double aga<strong>in</strong> (33%)<br />
before com<strong>in</strong>g to equilibrium <strong>in</strong> approximately 50 to<br />
200 years.<br />
At the time <strong>of</strong> writ<strong>in</strong>g, Land Monitor data from the<br />
Kellerberr<strong>in</strong>, Perth, Newdegate and Bencubb<strong>in</strong><br />
scenes are available for the central and Eastern<br />
<strong>Wheatbelt</strong>. Each scene represents over 1 M ha, and<br />
covers the area from Toodyay <strong>in</strong> the west, to<br />
Bullf<strong>in</strong>ch (north-east), Ravensthorpe (south-east),<br />
<strong>in</strong>clud<strong>in</strong>g a southern boundary near Lake Grace,<br />
Kond<strong>in</strong><strong>in</strong>, Quairad<strong>in</strong>g and P<strong>in</strong>gelly (Table 2). In this<br />
area, '<strong>sal<strong>in</strong>ity</strong>' has been def<strong>in</strong>ed and mapped as land<br />
hav<strong>in</strong>g 'consistent and low productivity due to<br />
shallow watertables'. It also <strong>in</strong>cludes many areas <strong>of</strong><br />
primary <strong>sal<strong>in</strong>ity</strong>, but usually excludes heavy barley<br />
grass pastures, sal<strong>in</strong>e remnants and lakes (water)<br />
which have been identified by field check<strong>in</strong>g. Field<br />
verified 'commission errors' (overestimates that<br />
<strong>in</strong>clude non-sal<strong>in</strong>e land) and 'omission errors'<br />
(underestimates <strong>of</strong> actual sal<strong>in</strong>e areas such as thick<br />
stands <strong>of</strong> barley grass and saltbush) are typically<br />
about 5% and 20% respectively. The process <strong>of</strong><br />
ground truth<strong>in</strong>g and statistical analysis has been<br />
described <strong>in</strong> more detail <strong>in</strong> each scene report which<br />
is available on the Land Monitor website<br />
(www.landmonitor.wa.gov.au/ – see Caccetta et al.<br />
2000; Caccetta et al. 2000b; Caccetta & Beetson<br />
2000; Dunne & Beetson 2000; Furby 2000).<br />
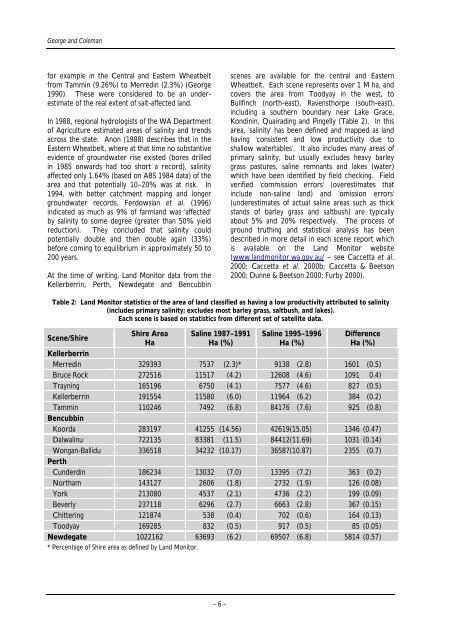
Table 2: Land Monitor statistics <strong>of</strong> the area <strong>of</strong> land classified as hav<strong>in</strong>g a low productivity attributed to <strong>sal<strong>in</strong>ity</strong><br />
(<strong>in</strong>cludes primary <strong>sal<strong>in</strong>ity</strong>; excludes most barley grass, saltbush, and lakes).<br />
Each scene is based on statistics from different set <strong>of</strong> satellite data.<br />
Scene/Shire<br />
Shire Area<br />
Ha<br />
Sal<strong>in</strong>e 1987–1991<br />
Ha (%)<br />
Sal<strong>in</strong>e 1995–1996<br />
Ha (%)<br />
Difference<br />
Ha (%)<br />
Kellerberr<strong>in</strong><br />
Merred<strong>in</strong> 329393 7537 (2.3)* 9138 (2.8) 1601 (0.5)<br />
Bruce Rock 272516 11517 (4.2) 12608 (4.6) 1091 0.4)<br />
Trayn<strong>in</strong>g 165196 6750 (4.1) 7577 (4.6) 827 (0.5)<br />
Kellerberr<strong>in</strong> 191554 11580 (6.0) 11964 (6.2) 384 (0.2)<br />
Tamm<strong>in</strong> 110246 7492 (6.8) 84176 (7.6) 925 (0.8)<br />
Bencubb<strong>in</strong><br />
Koorda 283197 41255 (14.56) 42619(15.05) 1346 (0.47)<br />
Dalwal<strong>in</strong>u 722135 83381 (11.5) 84412(11.69) 1031 (0.14)<br />
Wongan-Ballidu 336518 34232 (10.17) 36587(10.87) 2355 (0.7)<br />
Perth<br />
Cunderd<strong>in</strong> 186234 13032 (7.0) 13395 (7.2) 363 (0.2)<br />
Northam 143127 2606 (1.8) 2732 (1.9) 126 (0.08)<br />
York 213080 4537 (2.1) 4736 (2.2) 199 (0.09)<br />
Beverly 237118 6296 (2.7) 6663 (2.8) 367 (0.15)<br />
Chitter<strong>in</strong>g 121874 538 (0.4) 702 (0.6) 164 (0.13)<br />
Toodyay 169285 832 (0.5) 917 (0.5) 85 (0.05)<br />
Newdegate 1022162 63693 (6.2) 69507 (6.8) 5814 (0.57)<br />
* Percentage <strong>of</strong> Shire area as def<strong>in</strong>ed by Land Monitor.<br />
– 6 –


