

Dealing with salinity in Wheatbelt Valleys - Department of Water
Dealing with salinity in Wheatbelt Valleys - Department of Water
Dealing with salinity in Wheatbelt Valleys - Department of Water

You also want an ePaper? Increase the reach of your titles
YUMPU automatically turns print PDFs into web optimized ePapers that Google loves.
Morrell, Hatton and Curry<br />
6320000<br />
6300000<br />
6280000<br />
6260000<br />
6240000<br />
600000<br />
600000<br />
(<br />
330<br />
325<br />
NYABING<br />
620000<br />
320<br />
310<br />
FLOWNET<br />
WEST<br />
305<br />
620000<br />
315<br />
PINGRUP<br />
(<br />
290<br />
300<br />
ONGERUP<br />
(<br />
295<br />
640000<br />
295 300 305<br />
290<br />
640000<br />
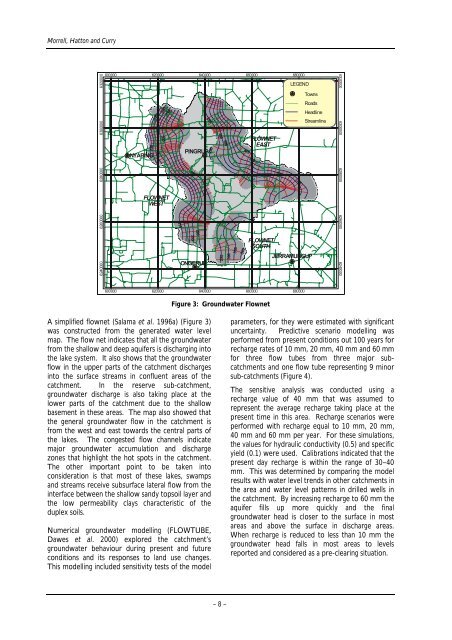
A simplified flownet (Salama et al. 1996a) (Figure 3)<br />
was constructed from the generated water level<br />
map. The flow net <strong>in</strong>dicates that all the groundwater<br />
from the shallow and deep aquifers is discharg<strong>in</strong>g <strong>in</strong>to<br />
the lake system. It also shows that the groundwater<br />
flow <strong>in</strong> the upper parts <strong>of</strong> the catchment discharges<br />
<strong>in</strong>to the surface streams <strong>in</strong> confluent areas <strong>of</strong> the<br />
catchment. In the reserve sub-catchment,<br />
groundwater discharge is also tak<strong>in</strong>g place at the<br />
lower parts <strong>of</strong> the catchment due to the shallow<br />
basement <strong>in</strong> these areas. The map also showed that<br />
the general groundwater flow <strong>in</strong> the catchment is<br />
from the west and east towards the central parts <strong>of</strong><br />
the lakes. The congested flow channels <strong>in</strong>dicate<br />
major groundwater accumulation and discharge<br />
zones that highlight the hot spots <strong>in</strong> the catchment.<br />
The other important po<strong>in</strong>t to be taken <strong>in</strong>to<br />
consideration is that most <strong>of</strong> these lakes, swamps<br />
and streams receive subsurface lateral flow from the<br />
<strong>in</strong>terface between the shallow sandy topsoil layer and<br />
the low permeability clays characteristic <strong>of</strong> the<br />
duplex soils.<br />
Numerical groundwater modell<strong>in</strong>g (FLOWTUBE,<br />
Dawes et al. 2000) explored the catchment’s<br />
groundwater behaviour dur<strong>in</strong>g present and future<br />
conditions and its responses to land use changes.<br />
This modell<strong>in</strong>g <strong>in</strong>cluded sensitivity tests <strong>of</strong> the model<br />
295<br />
300<br />
305<br />
310<br />
325<br />
660000<br />
FLOWNET<br />
EAST<br />
320<br />
FLOWNET<br />
SOUTH<br />
660000<br />
Figure 3: Groundwater Flownet<br />
– 8 –<br />
310<br />
680000<br />
LEGEND<br />
315<br />
JERRAMUNGUP<br />
(<br />
680000<br />
Towns<br />
Roads<br />
Headl<strong>in</strong>e<br />
Streaml<strong>in</strong>e<br />
parameters, for they were estimated <strong>with</strong> significant<br />
uncerta<strong>in</strong>ty. Predictive scenario modell<strong>in</strong>g was<br />
performed from present conditions out 100 years for<br />
recharge rates <strong>of</strong> 10 mm, 20 mm, 40 mm and 60 mm<br />
for three flow tubes from three major subcatchments<br />
and one flow tube represent<strong>in</strong>g 9 m<strong>in</strong>or<br />
sub-catchments (Figure 4).<br />
The sensitive analysis was conducted us<strong>in</strong>g a<br />
recharge value <strong>of</strong> 40 mm that was assumed to<br />
represent the average recharge tak<strong>in</strong>g place at the<br />
present time <strong>in</strong> this area. Recharge scenarios were<br />
performed <strong>with</strong> recharge equal to 10 mm, 20 mm,<br />
40 mm and 60 mm per year. For these simulations,<br />
the values for hydraulic conductivity (0.5) and specific<br />
yield (0.1) were used. Calibrations <strong>in</strong>dicated that the<br />
present day recharge is <strong>with</strong><strong>in</strong> the range <strong>of</strong> 30–40<br />
mm. This was determ<strong>in</strong>ed by compar<strong>in</strong>g the model<br />
results <strong>with</strong> water level trends <strong>in</strong> other catchments <strong>in</strong><br />
the area and water level patterns <strong>in</strong> drilled wells <strong>in</strong><br />
the catchment. By <strong>in</strong>creas<strong>in</strong>g recharge to 60 mm the<br />
aquifer fills up more quickly and the f<strong>in</strong>al<br />
groundwater head is closer to the surface <strong>in</strong> most<br />
areas and above the surface <strong>in</strong> discharge areas.<br />
When recharge is reduced to less than 10 mm the<br />
groundwater head falls <strong>in</strong> most areas to levels<br />
reported and considered as a pre-clear<strong>in</strong>g situation.<br />
6320000<br />
6300000<br />
6280000<br />
6260000<br />
6240000


