

Dealing with salinity in Wheatbelt Valleys - Department of Water
Dealing with salinity in Wheatbelt Valleys - Department of Water
Dealing with salinity in Wheatbelt Valleys - Department of Water

Create successful ePaper yourself
Turn your PDF publications into a flip-book with our unique Google optimized e-Paper software.
The ratio <strong>of</strong> the salt outputs to <strong>in</strong>puts (O/I) is an<br />
important <strong>in</strong>dicator <strong>of</strong> catchment <strong>sal<strong>in</strong>ity</strong> status.<br />
Prior to clear<strong>in</strong>g <strong>of</strong> native vegetation, the catchments<br />
would have been accumulat<strong>in</strong>g salt <strong>with</strong> a O/I ratio <strong>of</strong><br />
close to zero. After clear<strong>in</strong>g, the large fluxes <strong>of</strong><br />
water result<strong>in</strong>g from higher recharge and run<strong>of</strong>f<br />
<strong>in</strong>creases groundwater discharge and, as such,<br />
<strong>in</strong>creases salt load, lead<strong>in</strong>g to a salt O/I <strong>of</strong> greater<br />
than one. Smaller catchments <strong>with</strong><strong>in</strong> the Avon<br />
system have very high salt output to <strong>in</strong>put ratios,<br />
such as Mooranopp<strong>in</strong> Creek <strong>with</strong> an O/I <strong>of</strong> 39 and<br />
Dale River <strong>with</strong> an O/I <strong>of</strong> 28.<br />
Given the very high baseflow sal<strong>in</strong>ities (as an<br />
<strong>in</strong>dicator <strong>of</strong> salt storage) for both the Lockhart and<br />
Yilgarn rivers, the leach<strong>in</strong>g times or the time before<br />
most <strong>of</strong> the salt is leached from the catchment is <strong>of</strong><br />
the order <strong>of</strong> 100,000 years. For catchments <strong>with</strong><br />
lower salt storage and higher salt export the<br />
expected leach<strong>in</strong>g times are much less.<br />
Sediment and Nutrients<br />
From the perspective <strong>of</strong> the outlet <strong>of</strong> the Avon, the<br />
chief sources <strong>of</strong> sediment lie along the Avon River <strong>in</strong><br />
the region between Broun’s and Dunbarton Bridge<br />
(V<strong>in</strong>ey & Sivapalan 2001), suggest<strong>in</strong>g <strong>in</strong>-stream<br />
processes <strong>of</strong> sediment mobilisation. The ma<strong>in</strong> area<br />
for phosphorous discharge is Ellen Brook, part <strong>of</strong> the<br />
Swan system, <strong>with</strong> other significant discharges from<br />
Floodflow (m 3 /sec)<br />
1200<br />
1000<br />
800<br />
600<br />
400<br />
200<br />
Hatton and Ruprecht<br />
sub-catchments along the Avon between Julimar<br />
Brook and Broun’s. These areas co<strong>in</strong>cide <strong>with</strong> the<br />
westernmost (wettest) areas <strong>of</strong> the cleared<br />
agricultural country. It is important to note that<br />
these observations were for a period <strong>of</strong> 25 years<br />
<strong>with</strong> low mean annual ra<strong>in</strong>fall and no serious flood<strong>in</strong>g.<br />
These authors estimate that prior to clear<strong>in</strong>g, the<br />
sediment, total phosphorous and total nitrogen loads<br />
<strong>in</strong> the Avon were only 4, 5.6 and 4 percent <strong>of</strong> rates<br />
for the period 1970–1994 respectively. In absolute<br />
terms, V<strong>in</strong>ey & Sivapalan estimated that mean annual<br />
loads over this period for sediment, phosphorous<br />
and nitrogen were 55.2 kT, 0.077 kT and 0.563 kT<br />
respectively.<br />
Flood<strong>in</strong>g<br />
Avon River Flood<strong>in</strong>g<br />
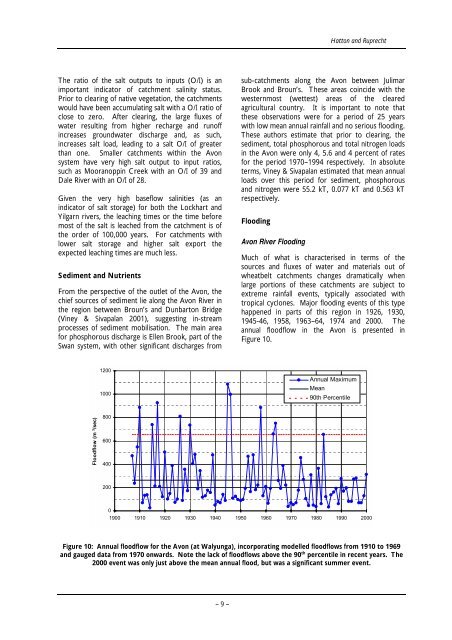
Much <strong>of</strong> what is characterised <strong>in</strong> terms <strong>of</strong> the<br />
sources and fluxes <strong>of</strong> water and materials out <strong>of</strong><br />
wheatbelt catchments changes dramatically when<br />
large portions <strong>of</strong> these catchments are subject to<br />
extreme ra<strong>in</strong>fall events, typically associated <strong>with</strong><br />
tropical cyclones. Major flood<strong>in</strong>g events <strong>of</strong> this type<br />
happened <strong>in</strong> parts <strong>of</strong> this region <strong>in</strong> 1926, 1930,<br />
1945-46, 1958, 1963–64, 1974 and 2000. The<br />
annual floodflow <strong>in</strong> the Avon is presented <strong>in</strong><br />
Figure 10.<br />
Annual Maximum<br />
Mean<br />
90th Percentile<br />
0<br />
1900 1910 1920 1930 1940 1950 1960 1970 1980 1990 2000<br />
Figure 10: Annual floodflow for the Avon (at Walyunga), <strong>in</strong>corporat<strong>in</strong>g modelled floodflows from 1910 to 1969<br />
and gauged data from 1970 onwards. Note the lack <strong>of</strong> floodflows above the 90 th percentile <strong>in</strong> recent years. The<br />
2000 event was only just above the mean annual flood, but was a significant summer event.<br />
– 9 –


