

Dealing with salinity in Wheatbelt Valleys - Department of Water
Dealing with salinity in Wheatbelt Valleys - Department of Water
Dealing with salinity in Wheatbelt Valleys - Department of Water

You also want an ePaper? Increase the reach of your titles
YUMPU automatically turns print PDFs into web optimized ePapers that Google loves.
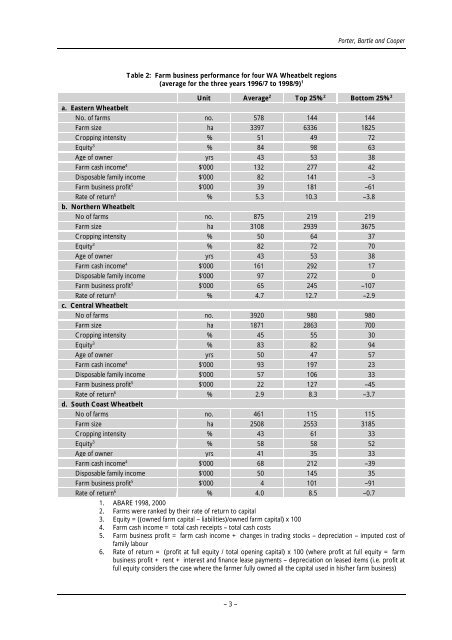
Table 2: Farm bus<strong>in</strong>ess performance for four WA <strong>Wheatbelt</strong> regions<br />
(average for the three years 1996/7 to 1998/9) 1<br />
Porter, Bartle and Cooper<br />
Unit Average2 Top 25% 2 Bottom 25% 2<br />
a. Eastern <strong>Wheatbelt</strong><br />
No. <strong>of</strong> farms no. 578 144 144<br />
Farm size ha 3397 6336 1825<br />
Cropp<strong>in</strong>g <strong>in</strong>tensity % 51 49 72<br />
Equity3 % 84 98 63<br />
Age <strong>of</strong> owner yrs 43 53 38<br />
Farm cash <strong>in</strong>come4 $'000 132 277 42<br />
Disposable family <strong>in</strong>come $'000 82 141 –3<br />
Farm bus<strong>in</strong>ess pr<strong>of</strong>it5 $'000 39 181 –61<br />
Rate <strong>of</strong> return6 b. Northern <strong>Wheatbelt</strong><br />
% 5.3 10.3 –3.8<br />
No <strong>of</strong> farms no. 875 219 219<br />
Farm size ha 3108 2939 3675<br />
Cropp<strong>in</strong>g <strong>in</strong>tensity % 50 64 37<br />
Equity3 % 82 72 70<br />
Age <strong>of</strong> owner yrs 43 53 38<br />
Farm cash <strong>in</strong>come4 $'000 161 292 17<br />
Disposable family <strong>in</strong>come $'000 97 272 0<br />
Farm bus<strong>in</strong>ess pr<strong>of</strong>it5 $'000 65 245 –107<br />
Rate <strong>of</strong> return6 c. Central <strong>Wheatbelt</strong><br />
% 4.7 12.7 –2.9<br />
No <strong>of</strong> farms no. 3920 980 980<br />
Farm size ha 1871 2863 700<br />
Cropp<strong>in</strong>g <strong>in</strong>tensity % 45 55 30<br />
Equity3 % 83 82 94<br />
Age <strong>of</strong> owner yrs 50 47 57<br />
Farm cash <strong>in</strong>come4 $'000 93 197 23<br />
Disposable family <strong>in</strong>come $'000 57 106 33<br />
Farm bus<strong>in</strong>ess pr<strong>of</strong>it5 $'000 22 127 –45<br />
Rate <strong>of</strong> return6 d. South Coast <strong>Wheatbelt</strong><br />
% 2.9 8.3 –3.7<br />
No <strong>of</strong> farms no. 461 115 115<br />
Farm size ha 2508 2553 3185<br />
Cropp<strong>in</strong>g <strong>in</strong>tensity % 43 61 33<br />
Equity3 % 58 58 52<br />
Age <strong>of</strong> owner yrs 41 35 33<br />
Farm cash <strong>in</strong>come4 $'000 68 212 –39<br />
Disposable family <strong>in</strong>come $'000 50 145 35<br />
Farm bus<strong>in</strong>ess pr<strong>of</strong>it5 $'000 4 101 –91<br />
Rate <strong>of</strong> return6 % 4.0 8.5 –0.7<br />
1. ABARE 1998, 2000<br />
2. Farms were ranked by their rate <strong>of</strong> return to capital<br />
3. Equity =((owned farm capital – liabilities)/owned farm capital) x 100<br />
4. Farm cash <strong>in</strong>come = total cash receipts – total cash costs<br />
5. Farm bus<strong>in</strong>ess pr<strong>of</strong>it = farm cash <strong>in</strong>come + changes <strong>in</strong> trad<strong>in</strong>g stocks – depreciation – imputed cost <strong>of</strong><br />
family labour<br />
6. Rate <strong>of</strong> return = (pr<strong>of</strong>it at full equity / total open<strong>in</strong>g capital) x 100 (where pr<strong>of</strong>it at full equity = farm<br />
bus<strong>in</strong>ess pr<strong>of</strong>it + rent + <strong>in</strong>terest and f<strong>in</strong>ance lease payments – depreciation on leased items (i.e. pr<strong>of</strong>it at<br />
full equity considers the case where the farmer fully owned all the capital used <strong>in</strong> his/her farm bus<strong>in</strong>ess)<br />
– 3 –


