

Dealing with salinity in Wheatbelt Valleys - Department of Water
Dealing with salinity in Wheatbelt Valleys - Department of Water
Dealing with salinity in Wheatbelt Valleys - Department of Water

Create successful ePaper yourself
Turn your PDF publications into a flip-book with our unique Google optimized e-Paper software.
Hatton and Ruprecht<br />
The comb<strong>in</strong>ation <strong>of</strong> variations due to ra<strong>in</strong>fall (and its<br />
spatial distribution) and the <strong>in</strong>ternal storage or<br />
overflow <strong>of</strong> run<strong>of</strong>f leads to large variability <strong>in</strong> stream<br />
<strong>sal<strong>in</strong>ity</strong> from year to year (Figure 8). This can prove<br />
difficult for the estimation <strong>of</strong> trends and the<br />
detection and evaluation <strong>of</strong> mitigation efforts.<br />
However, it is clear that the <strong>sal<strong>in</strong>ity</strong> <strong>in</strong> the Blackwood<br />
river has risen from less than 2,000 mg L –1 to greater<br />
than 4,000 mg L –1 over the last 40 years.<br />
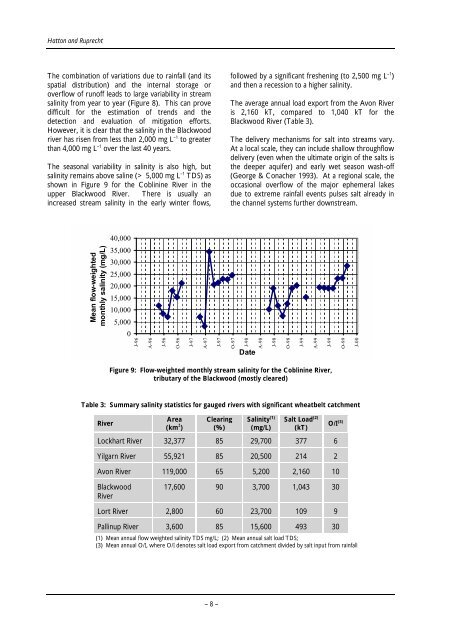
The seasonal variability <strong>in</strong> <strong>sal<strong>in</strong>ity</strong> is also high, but<br />
<strong>sal<strong>in</strong>ity</strong> rema<strong>in</strong>s above sal<strong>in</strong>e (> 5,000 mg L –1 TDS) as<br />
shown <strong>in</strong> Figure 9 for the Cobl<strong>in</strong><strong>in</strong>e River <strong>in</strong> the<br />
upper Blackwood River. There is usually an<br />
<strong>in</strong>creased stream <strong>sal<strong>in</strong>ity</strong> <strong>in</strong> the early w<strong>in</strong>ter flows,<br />
Mean flow-weighted<br />
monthly <strong>sal<strong>in</strong>ity</strong> (mg/L)<br />
40,000<br />
35,000<br />
30,000<br />
25,000<br />
20,000<br />
15,000<br />
10,000<br />
5,000<br />
0<br />
J-96<br />
A-96<br />
J-96<br />
O-96<br />
J-97<br />
A-97<br />
J-97<br />
followed by a significant freshen<strong>in</strong>g (to 2,500 mg L –1 )<br />
and then a recession to a higher <strong>sal<strong>in</strong>ity</strong>.<br />
The average annual load export from the Avon River<br />
is 2,160 kT, compared to 1,040 kT for the<br />
Blackwood River (Table 3).<br />
The delivery mechanisms for salt <strong>in</strong>to streams vary.<br />
At a local scale, they can <strong>in</strong>clude shallow throughflow<br />
delivery (even when the ultimate orig<strong>in</strong> <strong>of</strong> the salts is<br />
the deeper aquifer) and early wet season wash-<strong>of</strong>f<br />
(George & Conacher 1993). At a regional scale, the<br />
occasional overflow <strong>of</strong> the major ephemeral lakes<br />
due to extreme ra<strong>in</strong>fall events pulses salt already <strong>in</strong><br />
the channel systems further downstream.<br />
O-97<br />
J-98<br />
Date<br />
Figure 9: Flow-weighted monthly stream <strong>sal<strong>in</strong>ity</strong> for the Cobl<strong>in</strong><strong>in</strong>e River,<br />
tributary <strong>of</strong> the Blackwood (mostly cleared)<br />
Table 3: Summary <strong>sal<strong>in</strong>ity</strong> statistics for gauged rivers <strong>with</strong> significant wheatbelt catchment<br />
River<br />
Area<br />
(km 2 )<br />
Clear<strong>in</strong>g<br />
(%)<br />
A-98<br />
J-98<br />
Sal<strong>in</strong>ity (1)<br />
(mg/L)<br />
O-98<br />
J-99<br />
A-99<br />
Salt Load (2)<br />
(kT)<br />
Lockhart River 32,377 85 29,700 377 6<br />
Yilgarn River 55,921 85 20,500 214 2<br />
Avon River 119,000 65 5,200 2,160 10<br />
Blackwood<br />
River<br />
J-99<br />
O-99<br />
O/I (3)<br />
17,600 90 3,700 1,043 30<br />
Lort River 2,800 60 23,700 109 9<br />
Pall<strong>in</strong>up River 3,600 85 15,600 493 30<br />
(1) Mean annual flow weighted <strong>sal<strong>in</strong>ity</strong> TDS mg/L; (2) Mean annual salt load TDS;<br />
(3) Mean annual O/I, where O/I denotes salt load export from catchment divided by salt <strong>in</strong>put from ra<strong>in</strong>fall<br />
– 8 –<br />
J-00


