

Dealing with salinity in Wheatbelt Valleys - Department of Water
Dealing with salinity in Wheatbelt Valleys - Department of Water
Dealing with salinity in Wheatbelt Valleys - Department of Water

Create successful ePaper yourself
Turn your PDF publications into a flip-book with our unique Google optimized e-Paper software.
Sal<strong>in</strong>ity<br />
Monthly streamflow (ML)<br />
100<br />
90<br />
80<br />
70<br />
60<br />
50<br />
40<br />
30<br />
20<br />
10<br />
0<br />
0 20 40 60 80 100 120<br />
Monthly ra<strong>in</strong>fall (mm)<br />
– 7 –<br />
Hatton and Ruprecht<br />
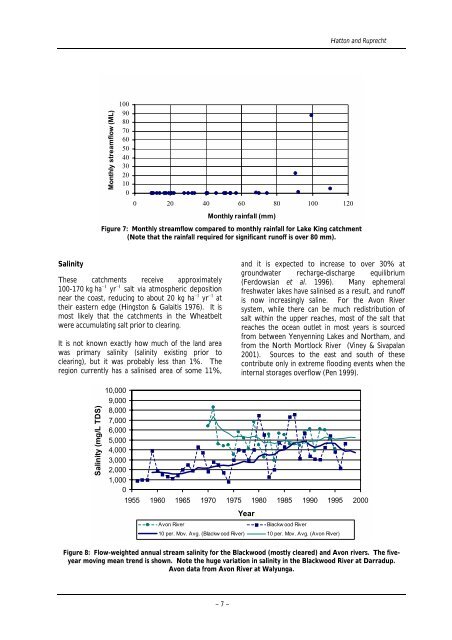
Figure 7: Monthly streamflow compared to monthly ra<strong>in</strong>fall for Lake K<strong>in</strong>g catchment<br />
(Note that the ra<strong>in</strong>fall required for significant run<strong>of</strong>f is over 80 mm).<br />
These catchments receive approximately<br />
100-170 kg ha –1 yr –1 salt via atmospheric deposition<br />
near the coast, reduc<strong>in</strong>g to about 20 kg ha –1 yr –1 at<br />
their eastern edge (H<strong>in</strong>gston & Galaitis 1976). It is<br />
most likely that the catchments <strong>in</strong> the <strong>Wheatbelt</strong><br />
were accumulat<strong>in</strong>g salt prior to clear<strong>in</strong>g.<br />
It is not known exactly how much <strong>of</strong> the land area<br />
was primary <strong>sal<strong>in</strong>ity</strong> (<strong>sal<strong>in</strong>ity</strong> exist<strong>in</strong>g prior to<br />
clear<strong>in</strong>g), but it was probably less than 1%. The<br />
region currently has a sal<strong>in</strong>ised area <strong>of</strong> some 11%,<br />
Sal<strong>in</strong>ity (mg/L TDS)<br />
10,000<br />
9,000<br />
8,000<br />
7,000<br />
6,000<br />
5,000<br />
4,000<br />
3,000<br />
2,000<br />
1,000<br />
0<br />
and it is expected to <strong>in</strong>crease to over 30% at<br />
groundwater recharge-discharge equilibrium<br />
(Ferdowsian et al. 1996). Many ephemeral<br />
freshwater lakes have sal<strong>in</strong>ised as a result, and run<strong>of</strong>f<br />
is now <strong>in</strong>creas<strong>in</strong>gly sal<strong>in</strong>e. For the Avon River<br />
system, while there can be much redistribution <strong>of</strong><br />
salt <strong>with</strong><strong>in</strong> the upper reaches, most <strong>of</strong> the salt that<br />
reaches the ocean outlet <strong>in</strong> most years is sourced<br />
from between Yenyenn<strong>in</strong>g Lakes and Northam, and<br />
from the North Mortlock River (V<strong>in</strong>ey & Sivapalan<br />
2001). Sources to the east and south <strong>of</strong> these<br />
contribute only <strong>in</strong> extreme flood<strong>in</strong>g events when the<br />
<strong>in</strong>ternal storages overflow (Pen 1999).<br />
1955 1960 1965 1970 1975 1980 1985 1990 1995 2000<br />
Year<br />
Avon River Blackw ood River<br />
10 per. Mov. Avg. (Blackw ood River) 10 per. Mov. Avg. (Avon River)<br />
Figure 8: Flow-weighted annual stream <strong>sal<strong>in</strong>ity</strong> for the Blackwood (mostly cleared) and Avon rivers. The fiveyear<br />
mov<strong>in</strong>g mean trend is shown. Note the huge variation <strong>in</strong> <strong>sal<strong>in</strong>ity</strong> <strong>in</strong> the Blackwood River at Darradup.<br />
Avon data from Avon River at Walyunga.


