

Dealing with salinity in Wheatbelt Valleys - Department of Water
Dealing with salinity in Wheatbelt Valleys - Department of Water
Dealing with salinity in Wheatbelt Valleys - Department of Water

Create successful ePaper yourself
Turn your PDF publications into a flip-book with our unique Google optimized e-Paper software.
Commander, Schoknecht, Verboom and Caccetta<br />
Here, ground level w<strong>in</strong>ds entra<strong>in</strong>ed sand size<br />
particles (2.0 - 0.05 mm <strong>in</strong> diameter) which moved<br />
by roll<strong>in</strong>g and saltation while f<strong>in</strong>er particles moved <strong>in</strong><br />
suspension after dislodgment by the saltat<strong>in</strong>g<br />
particles. The particles may themselves be quartz<br />
gra<strong>in</strong>s or aggregates <strong>of</strong> m<strong>in</strong>erals detached from mud<br />
curls and salt/mud efflorescences. Lunettes on the<br />
south eastern side <strong>of</strong> playas betray old north<br />
westerly w<strong>in</strong>ds. Lunette composition depends on<br />
provenance which <strong>in</strong> turn depends on hydrologic<br />
regimes. In other words, playas produc<strong>in</strong>g loose<br />
quartz sand generate sandy lunettes while those<br />
produc<strong>in</strong>g pelleted clayey aggregates generate clayey<br />
lunettes. F<strong>in</strong>er particles blow and saltate out greater<br />
distances form<strong>in</strong>g discont<strong>in</strong>uous sheets <strong>of</strong> parna<br />
(locally referred to as morrel soils) which may over<br />
pr<strong>in</strong>t hillslope soils.<br />
NEW GEOPHYSICAL PERSPECTIVES<br />
At the end <strong>of</strong> the day, the above described<br />
pedogenetic processes have to be consistent <strong>with</strong><br />
newly acquired data. Airborne geophysical mapp<strong>in</strong>g<br />
provides such data, <strong>of</strong>fer<strong>in</strong>g pedologists a new and<br />
penetrat<strong>in</strong>g perspective <strong>of</strong> soil landscapes. Below we<br />
first briefly describe these techniques and then use<br />
them to exam<strong>in</strong>e the relationship between<br />
radiometric and elevation data and the occurrence <strong>of</strong><br />
salts and soils <strong>in</strong> parts <strong>of</strong> the Avon, Lake Toolib<strong>in</strong> and<br />
Elashg<strong>in</strong> catchments.<br />
DIGITAL ELEVATION MODELS (DEM)<br />
A DEM is a digital representation <strong>of</strong> the earths’<br />
surface where, <strong>with</strong> the use <strong>of</strong> a computer, the<br />
elevation <strong>of</strong> a location on the ground (measured <strong>in</strong><br />
East<strong>in</strong>gs and North<strong>in</strong>gs, say) can easily be obta<strong>in</strong>ed<br />
by a simple click <strong>of</strong> a mouse button.<br />
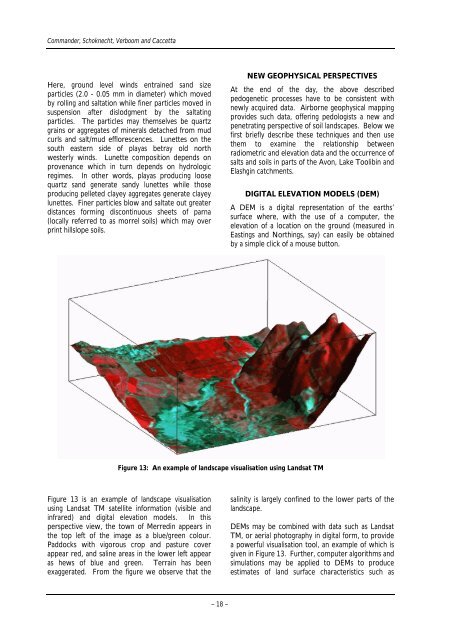
Figure 13: An example <strong>of</strong> landscape visualisation us<strong>in</strong>g Landsat TM<br />
Figure 13 is an example <strong>of</strong> landscape visualisation<br />
us<strong>in</strong>g Landsat TM satellite <strong>in</strong>formation (visible and<br />
<strong>in</strong>frared) and digital elevation models. In this<br />
perspective view, the town <strong>of</strong> Merred<strong>in</strong> appears <strong>in</strong><br />
the top left <strong>of</strong> the image as a blue/green colour.<br />
Paddocks <strong>with</strong> vigorous crop and pasture cover<br />
appear red, and sal<strong>in</strong>e areas <strong>in</strong> the lower left appear<br />
as hews <strong>of</strong> blue and green. Terra<strong>in</strong> has been<br />
exaggerated. From the figure we observe that the<br />
– 18 –<br />
<strong>sal<strong>in</strong>ity</strong> is largely conf<strong>in</strong>ed to the lower parts <strong>of</strong> the<br />
landscape.<br />
DEMs may be comb<strong>in</strong>ed <strong>with</strong> data such as Landsat<br />
TM, or aerial photography <strong>in</strong> digital form, to provide<br />
a powerful visualisation tool, an example <strong>of</strong> which is<br />
given <strong>in</strong> Figure 13. Further, computer algorithms and<br />
simulations may be applied to DEMs to produce<br />
estimates <strong>of</strong> land surface characteristics such as


