

Dealing with salinity in Wheatbelt Valleys - Department of Water
Dealing with salinity in Wheatbelt Valleys - Department of Water
Dealing with salinity in Wheatbelt Valleys - Department of Water

You also want an ePaper? Increase the reach of your titles
YUMPU automatically turns print PDFs into web optimized ePapers that Google loves.
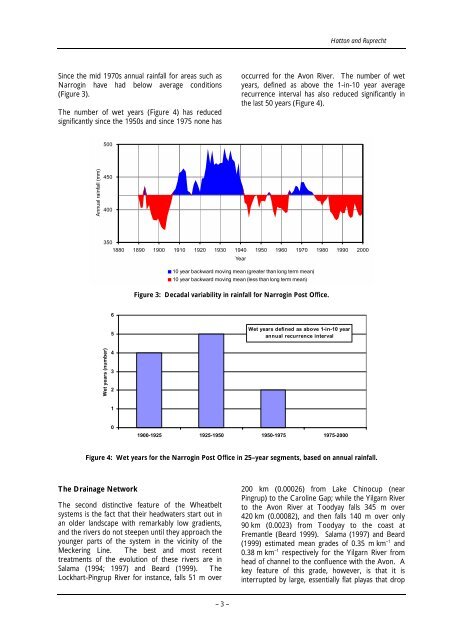
S<strong>in</strong>ce the mid 1970s annual ra<strong>in</strong>fall for areas such as<br />
Narrog<strong>in</strong> have had below average conditions<br />
(Figure 3).<br />
The number <strong>of</strong> wet years (Figure 4) has reduced<br />
significantly s<strong>in</strong>ce the 1950s and s<strong>in</strong>ce 1975 none has<br />
Annual ra<strong>in</strong>fall (mm)<br />
500<br />
450<br />
400<br />
Hatton and Ruprecht<br />
occurred for the Avon River. The number <strong>of</strong> wet<br />
years, def<strong>in</strong>ed as above the 1-<strong>in</strong>-10 year average<br />
recurrence <strong>in</strong>terval has also reduced significantly <strong>in</strong><br />
the last 50 years (Figure 4).<br />
350<br />
1880 1890 1900 1910 1920 1930 1940<br />
Year<br />
1950 1960 1970 1980 1990 2000<br />
Wet years (number)<br />
6<br />
5<br />
4<br />
3<br />
2<br />
1<br />
0<br />
10 year backward mov<strong>in</strong>g mean (greater than long term mean)<br />
10 year backward mov<strong>in</strong>g mean (less than long term mean)<br />
Figure 3: Decadal variability <strong>in</strong> ra<strong>in</strong>fall for Narrog<strong>in</strong> Post Office.<br />
Wet years def<strong>in</strong>ed as above 1-<strong>in</strong>-10 year<br />
annual recurrence <strong>in</strong>terval<br />
1900-1925 1925-1950 1950-1975 1975-2000<br />
Figure 4: Wet years for the Narrog<strong>in</strong> Post Office <strong>in</strong> 25–year segments, based on annual ra<strong>in</strong>fall.<br />
The Dra<strong>in</strong>age Network<br />
The second dist<strong>in</strong>ctive feature <strong>of</strong> the <strong>Wheatbelt</strong><br />
systems is the fact that their headwaters start out <strong>in</strong><br />
an older landscape <strong>with</strong> remarkably low gradients,<br />
and the rivers do not steepen until they approach the<br />
younger parts <strong>of</strong> the system <strong>in</strong> the vic<strong>in</strong>ity <strong>of</strong> the<br />
Mecker<strong>in</strong>g L<strong>in</strong>e. The best and most recent<br />
treatments <strong>of</strong> the evolution <strong>of</strong> these rivers are <strong>in</strong><br />
Salama (1994; 1997) and Beard (1999). The<br />
Lockhart-P<strong>in</strong>grup River for <strong>in</strong>stance, falls 51 m over<br />
– 3 –<br />
200 km (0.00026) from Lake Ch<strong>in</strong>ocup (near<br />
P<strong>in</strong>grup) to the Carol<strong>in</strong>e Gap; while the Yilgarn River<br />
to the Avon River at Toodyay falls 345 m over<br />
420 km (0.00082), and then falls 140 m over only<br />
90 km (0.0023) from Toodyay to the coast at<br />
Fremantle (Beard 1999). Salama (1997) and Beard<br />
(1999) estimated mean grades <strong>of</strong> 0.35 m km –1 and<br />
0.38 m km –1 respectively for the Yilgarn River from<br />
head <strong>of</strong> channel to the confluence <strong>with</strong> the Avon. A<br />
key feature <strong>of</strong> this grade, however, is that it is<br />
<strong>in</strong>terrupted by large, essentially flat playas that drop


