

Dealing with salinity in Wheatbelt Valleys - Department of Water
Dealing with salinity in Wheatbelt Valleys - Department of Water
Dealing with salinity in Wheatbelt Valleys - Department of Water

You also want an ePaper? Increase the reach of your titles
YUMPU automatically turns print PDFs into web optimized ePapers that Google loves.
<strong>with</strong> Sal<strong>in</strong>ity <strong>in</strong> <strong>Wheatbelt</strong> <strong>Valleys</strong> Conference<br />
<strong>Deal<strong>in</strong>g</strong><br />
Prospects and Practical Options<br />
Processes,<br />
Vision Sett<strong>in</strong>g<br />
The <strong>in</strong>itial response to the survey showed that the vast majority <strong>of</strong> people attend<strong>in</strong>g the conference were <strong>in</strong><br />
support <strong>with</strong> the statement that it is important to have a shared vision for <strong>sal<strong>in</strong>ity</strong> <strong>in</strong> wheatbelt valleys (43%<br />
agreed; 47% strongly agreed). This perception was strengthened at the conclusion <strong>of</strong> the conference, <strong>with</strong><br />
the percentage <strong>of</strong> respondents who strongly agreed <strong>with</strong> the statement <strong>in</strong>creas<strong>in</strong>g to 57 per cent.<br />
Respondents were also asked to prioritise what groups should be <strong>in</strong>cluded <strong>in</strong> the vision . 2 To analyse this<br />
question we considered cumulative values. For <strong>in</strong>stance, to obta<strong>in</strong> the percentage <strong>of</strong> people that ranked<br />
neighbours as their third choice, we would add together the percentages <strong>of</strong> people that ranked it as their<br />
first, second and third choice.<br />
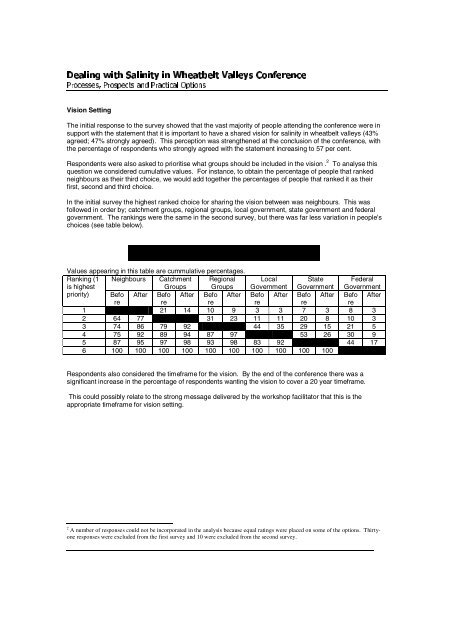
In the <strong>in</strong>itial survey the highest ranked choice for shar<strong>in</strong>g the vision between was neighbours. This was<br />
followed <strong>in</strong> order by; catchment groups, regional groups, local government, state government and federal<br />
government. The rank<strong>in</strong>gs were the same <strong>in</strong> the second survey, but there was far less variation <strong>in</strong> people’s<br />
choices (see table below).<br />
Question 3.2 Who should the vision be shared between?<br />
Values appear<strong>in</strong>g <strong>in</strong> this table are cummulative percentages.<br />
Rank<strong>in</strong>g (1 Neighbours Catchment Regional Local State Federal<br />
is highest<br />
Groups Groups Government Government Government<br />
priority) Befo After Befo After Befo After Befo After Befo After Befo After<br />
re<br />
re<br />
re<br />
re<br />
re<br />
re<br />
1 56 68 21 14 10 9 3 3 7 3 8 3<br />
2 64 77 67 80 31 23 11 11 20 8 10 3<br />
3 74 86 79 92 57 68 44 35 29 15 21 5<br />
4 75 92 89 94 87 97 69 82 53 26 30 9<br />
5 87 95 97 98 93 98 83 92 98 98 44 17<br />
6 100 100 100 100 100 100 100 100 100 100 100 100<br />
Respondents also considered the timeframe for the vision. By the end <strong>of</strong> the conference there was a<br />
significant <strong>in</strong>crease <strong>in</strong> the percentage <strong>of</strong> respondents want<strong>in</strong>g the vision to cover a 20 year timeframe.<br />
This could possibly relate to the strong message delivered by the workshop facilitator that this is the<br />
appropriate timeframe for vision sett<strong>in</strong>g.<br />
2 A number <strong>of</strong> responses could not be <strong>in</strong>corporated <strong>in</strong> the analysis because equal rat<strong>in</strong>gs were placed on some <strong>of</strong> the options. Thirtyone<br />
responses were excluded from the first survey and 10 were excluded from the second survey.


