

Dealing with salinity in Wheatbelt Valleys - Department of Water
Dealing with salinity in Wheatbelt Valleys - Department of Water
Dealing with salinity in Wheatbelt Valleys - Department of Water

Create successful ePaper yourself
Turn your PDF publications into a flip-book with our unique Google optimized e-Paper software.
Hatton and Ruprecht<br />
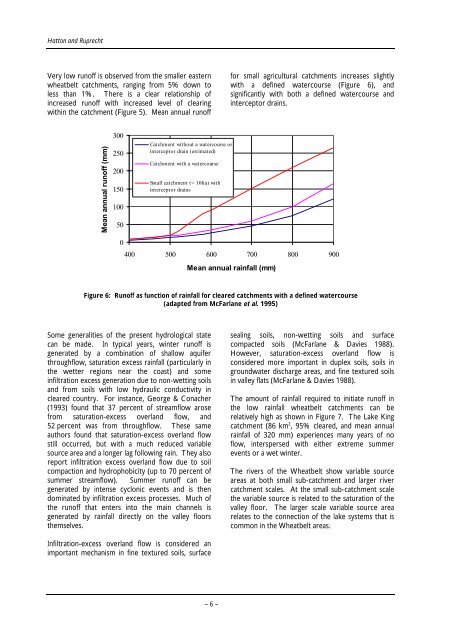
Very low run<strong>of</strong>f is observed from the smaller eastern<br />
wheatbelt catchments, rang<strong>in</strong>g from 5% down to<br />
less than 1%. There is a clear relationship <strong>of</strong><br />
<strong>in</strong>creased run<strong>of</strong>f <strong>with</strong> <strong>in</strong>creased level <strong>of</strong> clear<strong>in</strong>g<br />
<strong>with</strong><strong>in</strong> the catchment (Figure 5). Mean annual run<strong>of</strong>f<br />
Mean annual run<strong>of</strong>f (mm)<br />
300<br />
250<br />
200<br />
150<br />
100<br />
50<br />
0<br />
Catchment <strong>with</strong>out a watercourse or<br />
<strong>in</strong>terceptor dra<strong>in</strong> (estimated)<br />
Catchment <strong>with</strong> a watercourse<br />
Small catchment (< 10ha) <strong>with</strong><br />
<strong>in</strong>terceptor dra<strong>in</strong>s<br />
for small agricultural catchments <strong>in</strong>creases slightly<br />
<strong>with</strong> a def<strong>in</strong>ed watercourse (Figure 6), and<br />
significantly <strong>with</strong> both a def<strong>in</strong>ed watercourse and<br />
<strong>in</strong>terceptor dra<strong>in</strong>s.<br />
400 500 600 700 800 900<br />
Mean annual ra<strong>in</strong>fall (mm)<br />
Figure 6: Run<strong>of</strong>f as function <strong>of</strong> ra<strong>in</strong>fall for cleared catchments <strong>with</strong> a def<strong>in</strong>ed watercourse<br />
(adapted from McFarlane et al. 1995)<br />
Some generalities <strong>of</strong> the present hydrological state<br />
can be made. In typical years, w<strong>in</strong>ter run<strong>of</strong>f is<br />
generated by a comb<strong>in</strong>ation <strong>of</strong> shallow aquifer<br />
throughflow, saturation excess ra<strong>in</strong>fall (particularly <strong>in</strong><br />
the wetter regions near the coast) and some<br />
<strong>in</strong>filtration excess generation due to non-wett<strong>in</strong>g soils<br />
and from soils <strong>with</strong> low hydraulic conductivity <strong>in</strong><br />
cleared country. For <strong>in</strong>stance, George & Conacher<br />
(1993) found that 37 percent <strong>of</strong> streamflow arose<br />
from saturation-excess overland flow, and<br />
52 percent was from throughflow. These same<br />
authors found that saturation-excess overland flow<br />
still occurred, but <strong>with</strong> a much reduced variable<br />
source area and a longer lag follow<strong>in</strong>g ra<strong>in</strong>. They also<br />
report <strong>in</strong>filtration excess overland flow due to soil<br />
compaction and hydrophobicity (up to 70 percent <strong>of</strong><br />
summer streamflow). Summer run<strong>of</strong>f can be<br />
generated by <strong>in</strong>tense cyclonic events and is then<br />
dom<strong>in</strong>ated by <strong>in</strong>filtration excess processes. Much <strong>of</strong><br />
the run<strong>of</strong>f that enters <strong>in</strong>to the ma<strong>in</strong> channels is<br />
generated by ra<strong>in</strong>fall directly on the valley floors<br />
themselves.<br />
Infiltration-excess overland flow is considered an<br />
important mechanism <strong>in</strong> f<strong>in</strong>e textured soils, surface<br />
– 6 –<br />
seal<strong>in</strong>g soils, non-wett<strong>in</strong>g soils and surface<br />
compacted soils (McFarlane & Davies 1988).<br />
However, saturation-excess overland flow is<br />
considered more important <strong>in</strong> duplex soils, soils <strong>in</strong><br />
groundwater discharge areas, and f<strong>in</strong>e textured soils<br />
<strong>in</strong> valley flats (McFarlane & Davies 1988).<br />
The amount <strong>of</strong> ra<strong>in</strong>fall required to <strong>in</strong>itiate run<strong>of</strong>f <strong>in</strong><br />
the low ra<strong>in</strong>fall wheatbelt catchments can be<br />
relatively high as shown <strong>in</strong> Figure 7. The Lake K<strong>in</strong>g<br />
catchment (86 km 2 , 95% cleared, and mean annual<br />
ra<strong>in</strong>fall <strong>of</strong> 320 mm) experiences many years <strong>of</strong> no<br />
flow, <strong>in</strong>terspersed <strong>with</strong> either extreme summer<br />
events or a wet w<strong>in</strong>ter.<br />
The rivers <strong>of</strong> the <strong>Wheatbelt</strong> show variable source<br />
areas at both small sub-catchment and larger river<br />
catchment scales. At the small sub-catchment scale<br />
the variable source is related to the saturation <strong>of</strong> the<br />
valley floor. The larger scale variable source area<br />
relates to the connection <strong>of</strong> the lake systems that is<br />
common <strong>in</strong> the <strong>Wheatbelt</strong> areas.


