

Kuwait Corporate Fact Sheet
Kuwait Corporate Fact Sheet
Kuwait Corporate Fact Sheet

You also want an ePaper? Increase the reach of your titles
YUMPU automatically turns print PDFs into web optimized ePapers that Google loves.
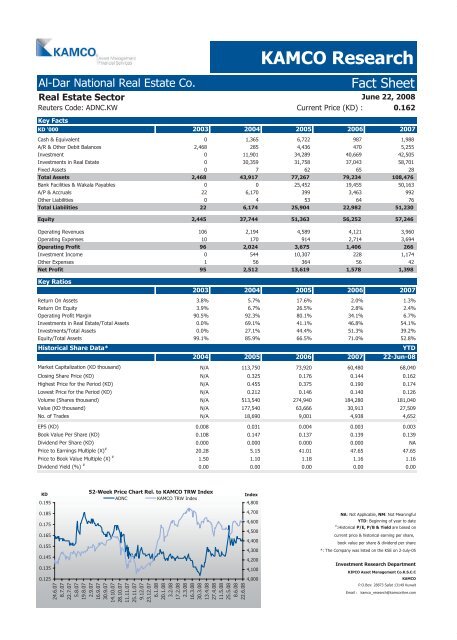
Al-Dar National Real Estate Co. <strong>Fact</strong> <strong>Sheet</strong><br />
Real Estate Sector<br />
June 22, 2008<br />
Reuters Code: ADNC.KW Current Price (KD) : 0.162<br />
Key <strong>Fact</strong>s<br />
KD '000 2003 2004 2005 2006 2007<br />
Cash & Equivalent 0 1,365 6,722 987 1,988<br />
A/R & Other Debit Balances 2,468 285 4,436 470 5,255<br />
Investment 0 11,901 34,289 40,669 42,505<br />
Investments in Real Estate 0 30,359 31,758 37,043 58,701<br />
Fixed Assets 0 7 62 65 28<br />
Total Assets 2,468 43,917 77,267 79,234 108,476<br />
Bank Facilities & Wakala Payables 0 0 25,452 19,455 50,163<br />
A/P & Accruals 22 6,170 399 3,463 992<br />
Other Liabilities 0 4 53 64 76<br />
Total Liabilities 22 6,174 25,904 22,982 51,230<br />
Equity 2,445 37,744 51,363 56,252 57,246<br />
Operating Revenues 106 2,194 4,589 4,121 3,960<br />
Operating Expenses 10 170 914 2,714 3,694<br />
Operating Profit 96 2,024 3,675 1,406 266<br />
Investment Income 0 544 10,307 228 1,174<br />
Other Expenses 1 56 364 56 42<br />
Net Profit 95 2,512 13,619 1,578 1,398<br />
Key Ratios<br />
KAMCO Research<br />
2003 2004 2005 2006 2007<br />
Return On Assets 3.8% 5.7% 17.6% 2.0% 1.3%<br />
Return On Equity 3.9% 6.7% 26.5% 2.8% 2.4%<br />
Operating Profit Margin 90.5% 92.3% 80.1% 34.1% 6.7%<br />
Investments in Real Estate/Total Assets 0.0% 69.1% 41.1% 46.8% 54.1%<br />
Investments/Total Assets 0.0% 27.1% 44.4% 51.3% 39.2%<br />
Equity/Total Assets 99.1% 85.9% 66.5% 71.0% 52.8%<br />
Historical Share Data* YTD<br />
2004 2005 2006 2007 22-Jun-08<br />
Market Capitalization (KD thousand) N/A 113,750 73,920 60,480 68,040<br />
Closing Share Price (KD) N/A 0.325 0.176 0.144 0.162<br />
Highest Price for the Period (KD) N/A 0.455 0.375 0.190 0.174<br />
Lowest Price for the Period (KD) N/A 0.212 0.146 0.140 0.126<br />
Volume (Shares thousand) N/A 513,540 274,940 184,280 181,040<br />
Value (KD thousand) N/A 177,540 63,666 30,913 27,509<br />
No. of Trades N/A 18,690 9,001 4,938 4,652<br />
EPS (KD) 0.008 0.031 0.004 0.003 0.003<br />
Book Value Per Share (KD) 0.108 0.147 0.137 0.139 0.139<br />
Dividend Per Share (KD) 0.000 0.000 0.000 0.000 NA<br />
Price to Earnings Multiple (X) #<br />
20.28 5.15 41.01 47.65 47.65<br />
Price to Book Value Multiple (X) #<br />
1.50 1.10 1.18 1.16 1.16<br />
Dividend Yield (%) #<br />
0.00 0.00 0.00 0.00 0.00<br />
KD<br />
0.195<br />
0.185<br />
0.175<br />
0.165<br />
0.155<br />
0.145<br />
0.135<br />
0.125<br />
52-Week Price Chart Rel. to KAMCO TRW Index<br />
ADNC KAMCO TRW Index<br />
Index<br />
24.6.07<br />
8.7.07<br />
22.7.07<br />
5.8.07<br />
19.8.07<br />
2.9.07<br />
16.9.07<br />
30.9.07<br />
14.10.07<br />
28.10.07<br />
11.11.07<br />
25.11.07<br />
9.12.07<br />
23.12.07<br />
6.1.08<br />
20.1.08<br />
3.2.08<br />
17.2.08<br />
2.3.08<br />
16.3.08<br />
30.3.08<br />
13.4.08<br />
27.4.08<br />
11.5.08<br />
25.5.08<br />
8.6.08<br />
22.6.08<br />
4,800<br />
4,700<br />
4,600<br />
4,500<br />
4,400<br />
4,300<br />
4,200<br />
4,100<br />
4,000<br />
NA: Not Applicable, NM: Not Meaningful<br />
YTD: Beginning of year to date<br />
#<br />
:Historical P/E, P/B & Yield are based on<br />
current price & historical earning per share,<br />
book value per share & dividend per share<br />
*: The Company was listed on the KSE on 2-July-05<br />
Investment Research Department<br />
KIPCO Asset Management Co.K.S.C.C<br />
KAMCO<br />
P.O.Box: 28873 Safat 13149 <strong>Kuwait</strong><br />
Email : kamco_research@kamconline.com


